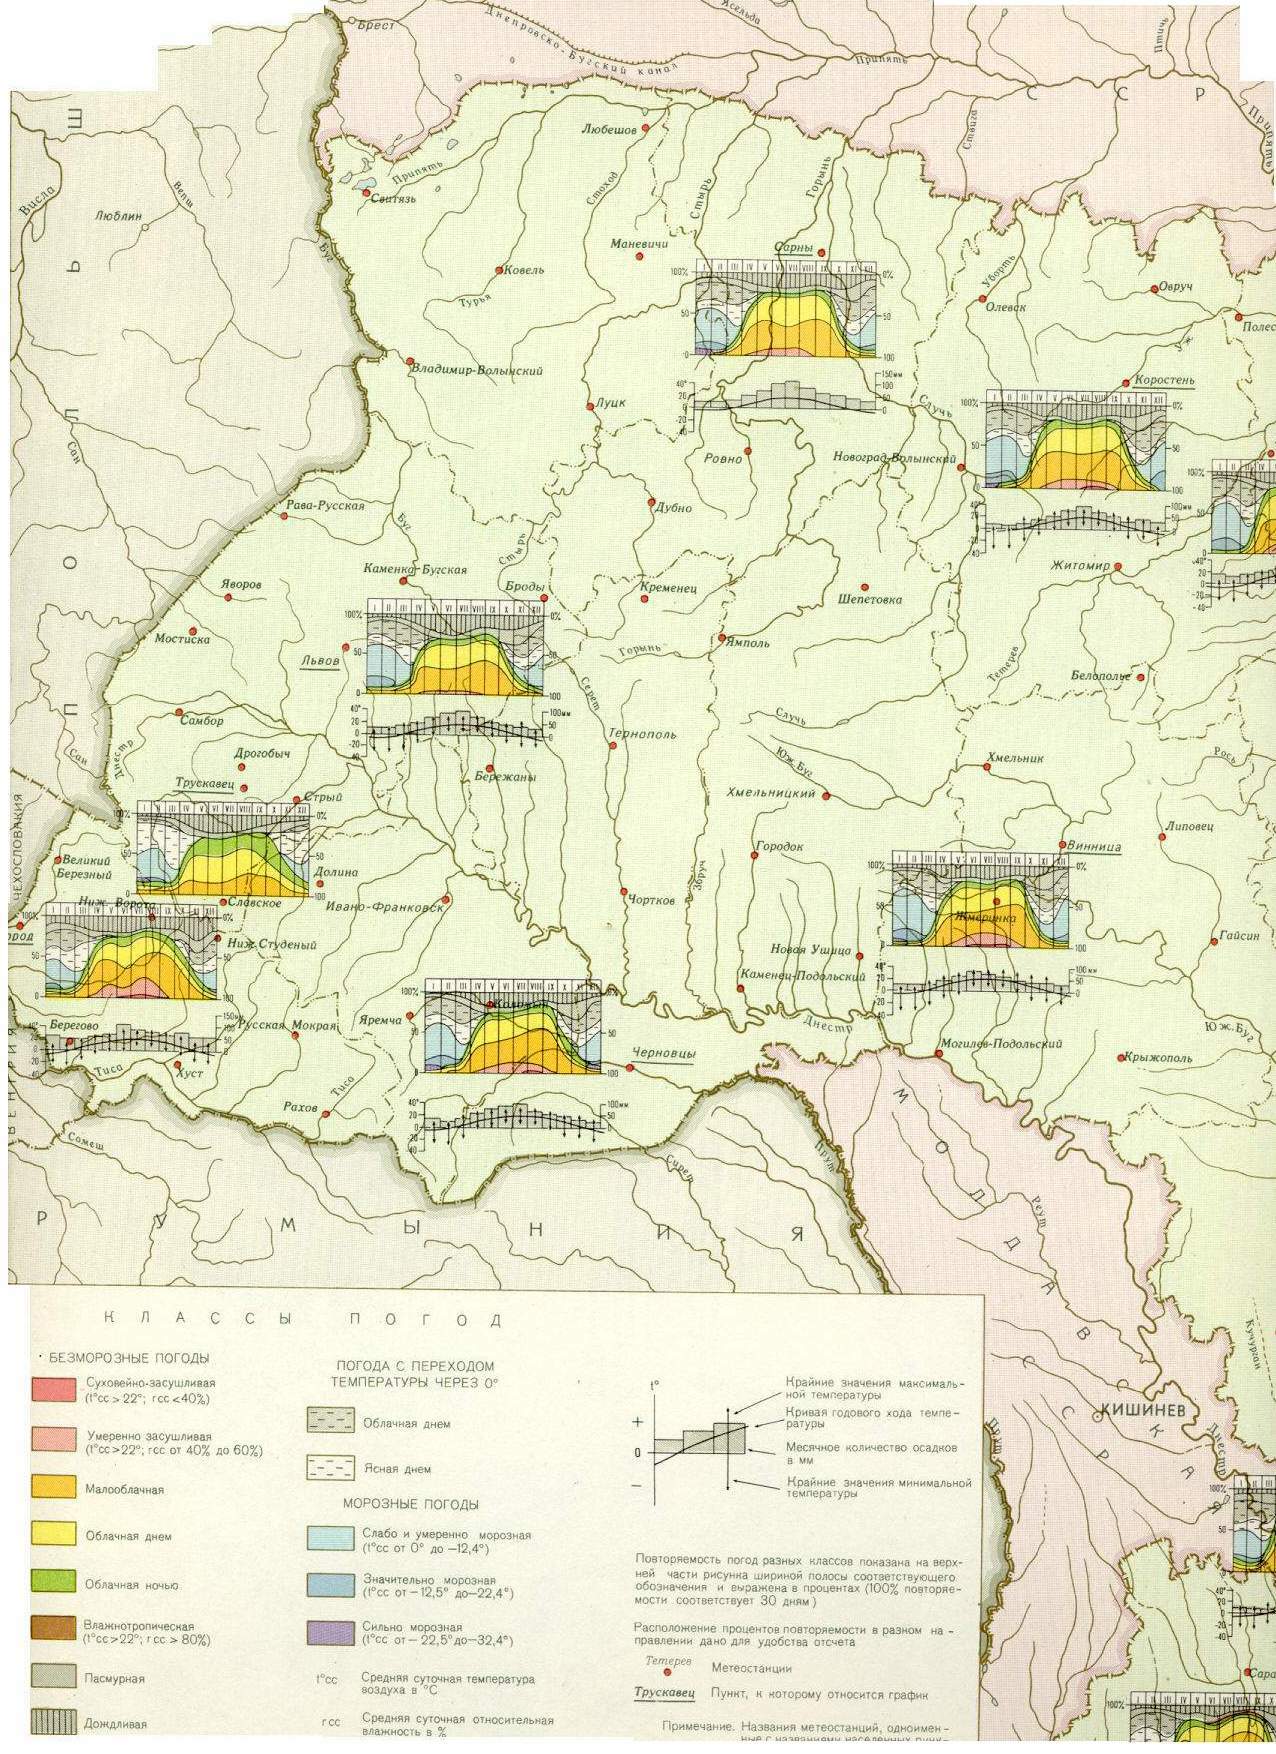
Method of localized diagrams.
Localized diagrams are used for representation of different events distribution either of solid or linear. They can also characterize fluctuation of the event's course, its size, duration or convertibility in points, which are exactly defined. In order to build a diagram it`s necessary to choose a place, that shows peculiarities of the territory in the best way. Localized diagrams are used most of all to characterize meteorological events, for example, annual course of temperature distribution of precipitations by the months, snow cover dynamics, distribution of direction and strength of the winds, etc.
Diagrams defining changes in time of some quantitative index are constructed in rectangular or polar systems of coordinates. They are usually presented in the shape of distribution curve or histogram. The evident advantage of localized diagrams is an opportunity of combining in one diagram two, three and more indexes; for example, annual course of temperature through the year, rainfall by the months and level relative humidity.
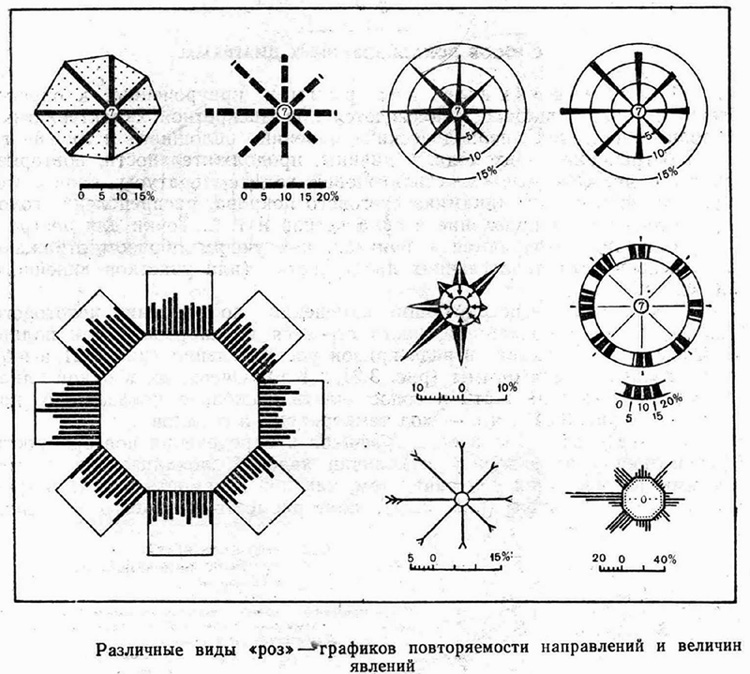
Another widespread type of diagrams is "rose" where graph represents directions and size of events. Localized diagrams of this kind are used for such topics as recurrence and strength of winds of different direction, recurrence and speed of sea currents, etc. There is a great variety of "roses".
Sometimes diagrams summarize data that are received from the particular region for example, within the limits of one grid that size is set beforehand (for example, 10 degrees) and can be localized in their center. In this case diagrams represent averaged characteristic their comparison allows to make conclusions of the spatial change that has happen with the event. Such types of graphs are used for characteristics of non-recurrent events, for instance, direction of the prevalent overthrust breaks within the limits of one region.