
Runnabilty chart (example)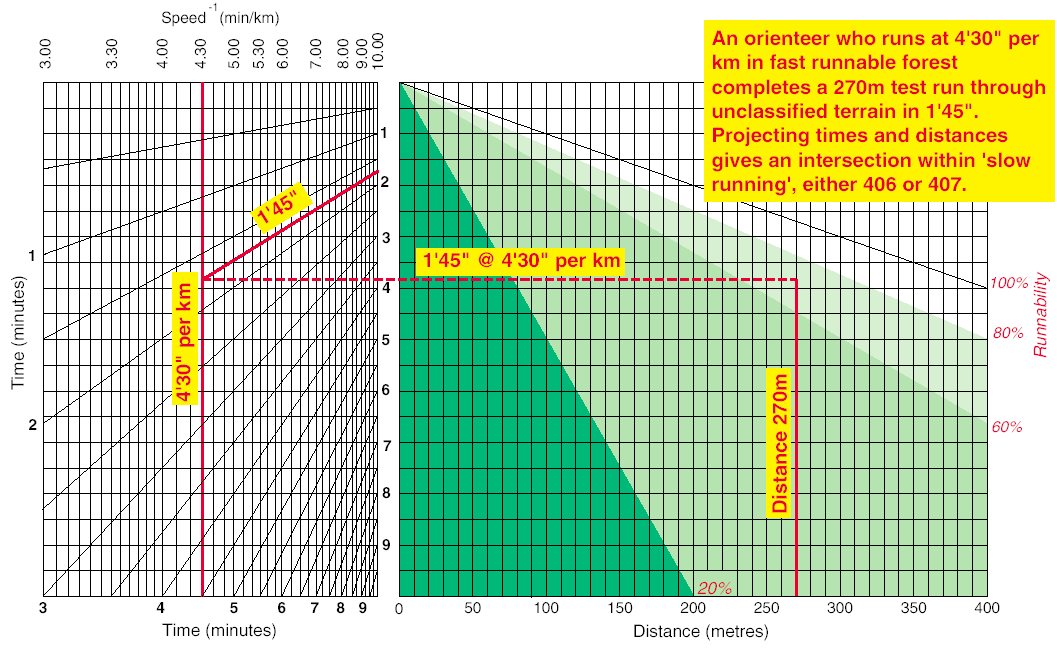
It often helps mappers to interpret runnability in the terrain if some practical tests are carried out.
How to interpret the runnability chart:
A pre-condition for the interpretation is to know one's running speed per kilometre in a fast running area (100 % of the running speed during a race).
The orienteer draws a vertical line for his running speed on the left hand part of the chart (speed scale along top left).
Next the orienteer selects some flat homogeneous vegetation which needs assessing for runnability. He runs through the vegetation for a known distance (should be at least 125m) and records the time it takes.
The time is marked by the sloping lines (scale left, bottom and right) on the left hand chart. Mark the intersection of the recorded time with the orienteers speed (vertical line previously drawn). Project a horizontal line from the intersection onto the right hand chart. Draw a vertical line using the bottom scale to indicate the distance ran. The intersection of the horizontal and vertical lines on the right hand chart will fall in one of four classifications of runnability (the coloured areas). That indicates the runnability for that vegetation. If the intersection is on the borderline of two classification, the slower classification is chosen.