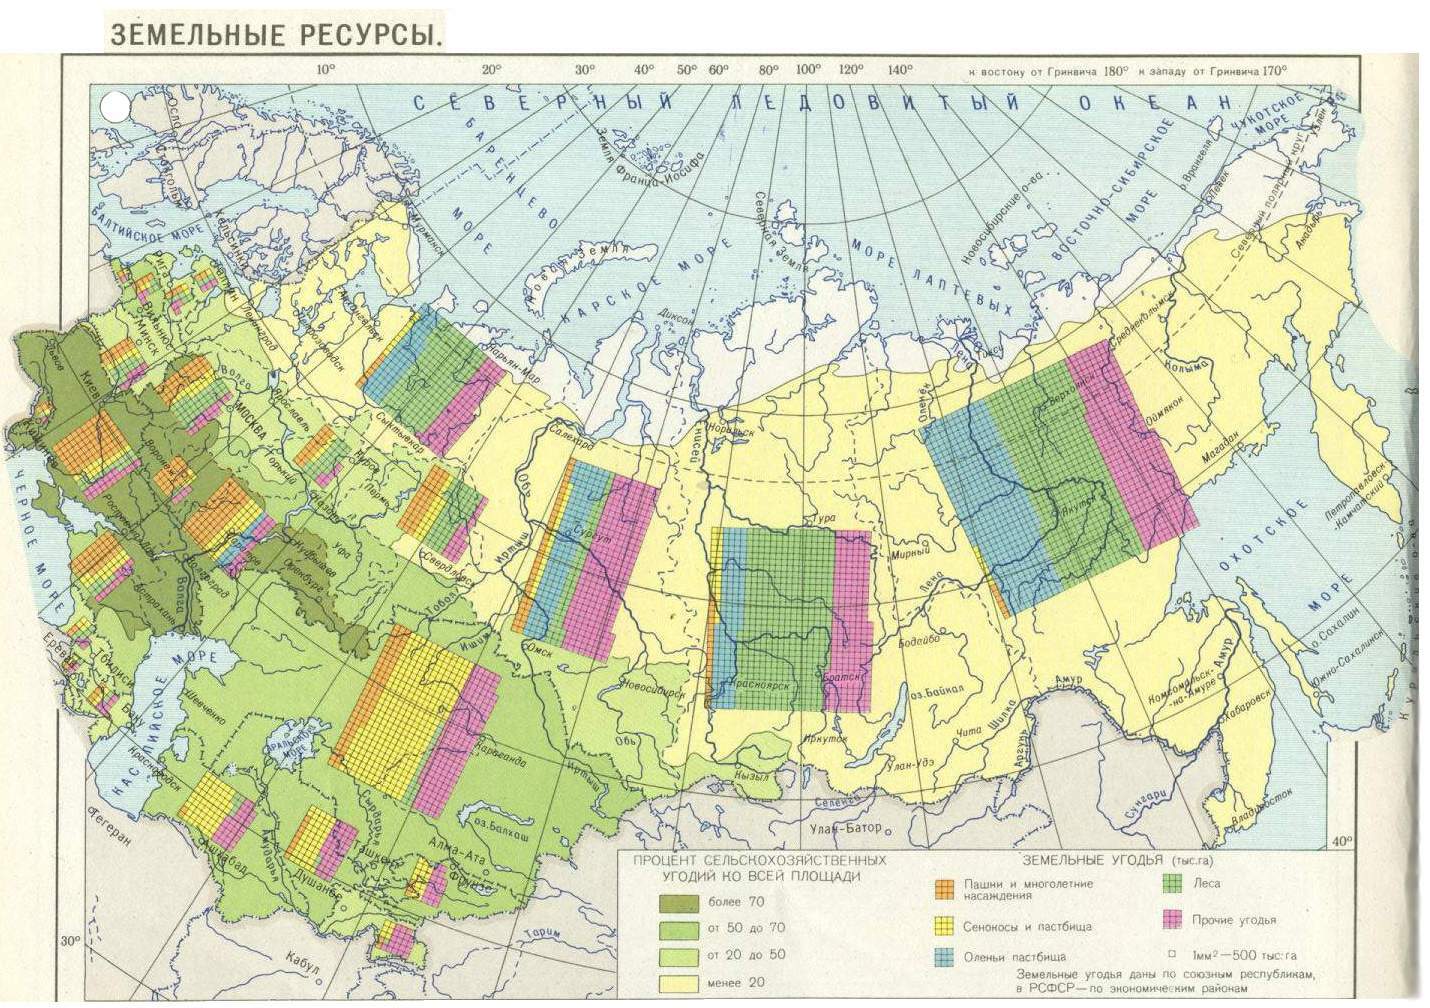
Diagram map is a method of representation of any event distribution by means of diagrams, that are placed on the map inside of the structure of territorial division (more often administrative) and that express the summarized value of this event within the limits of this territorial structure. Diagram maps are used for visual comparison of plough-lands, pastures, forest lands, etc.
Since most part of statistical information is operated by districts, regions, areas or other territorial units and not by single settlement, this method of representation is widely used in the modern cartography. Diagram map contain statistical data about different events, but doesn't show how these events distribute inside the territorial structure.
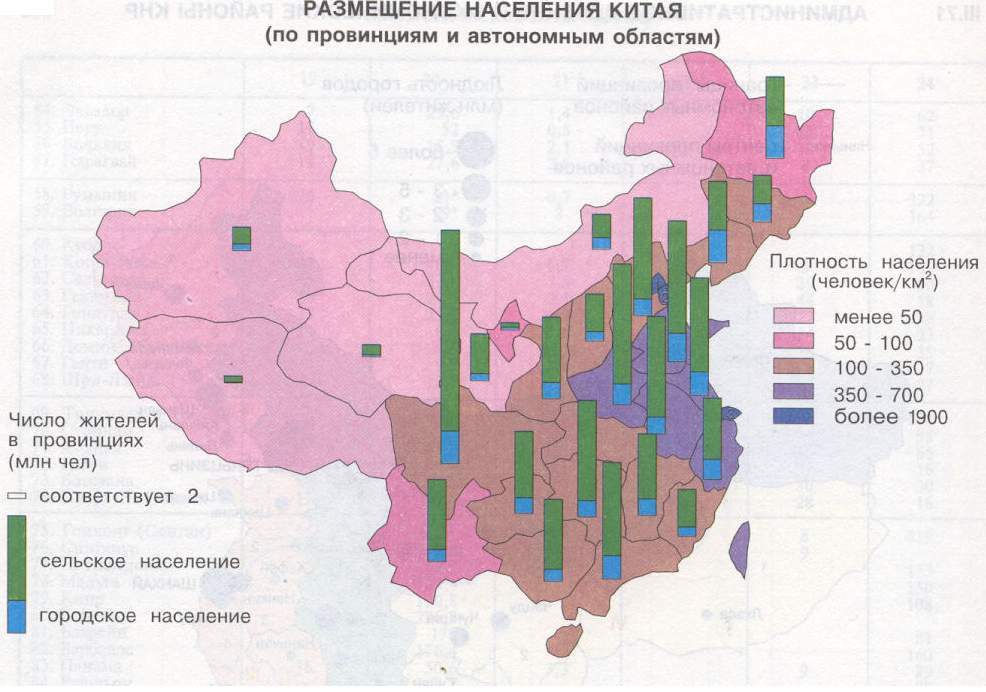
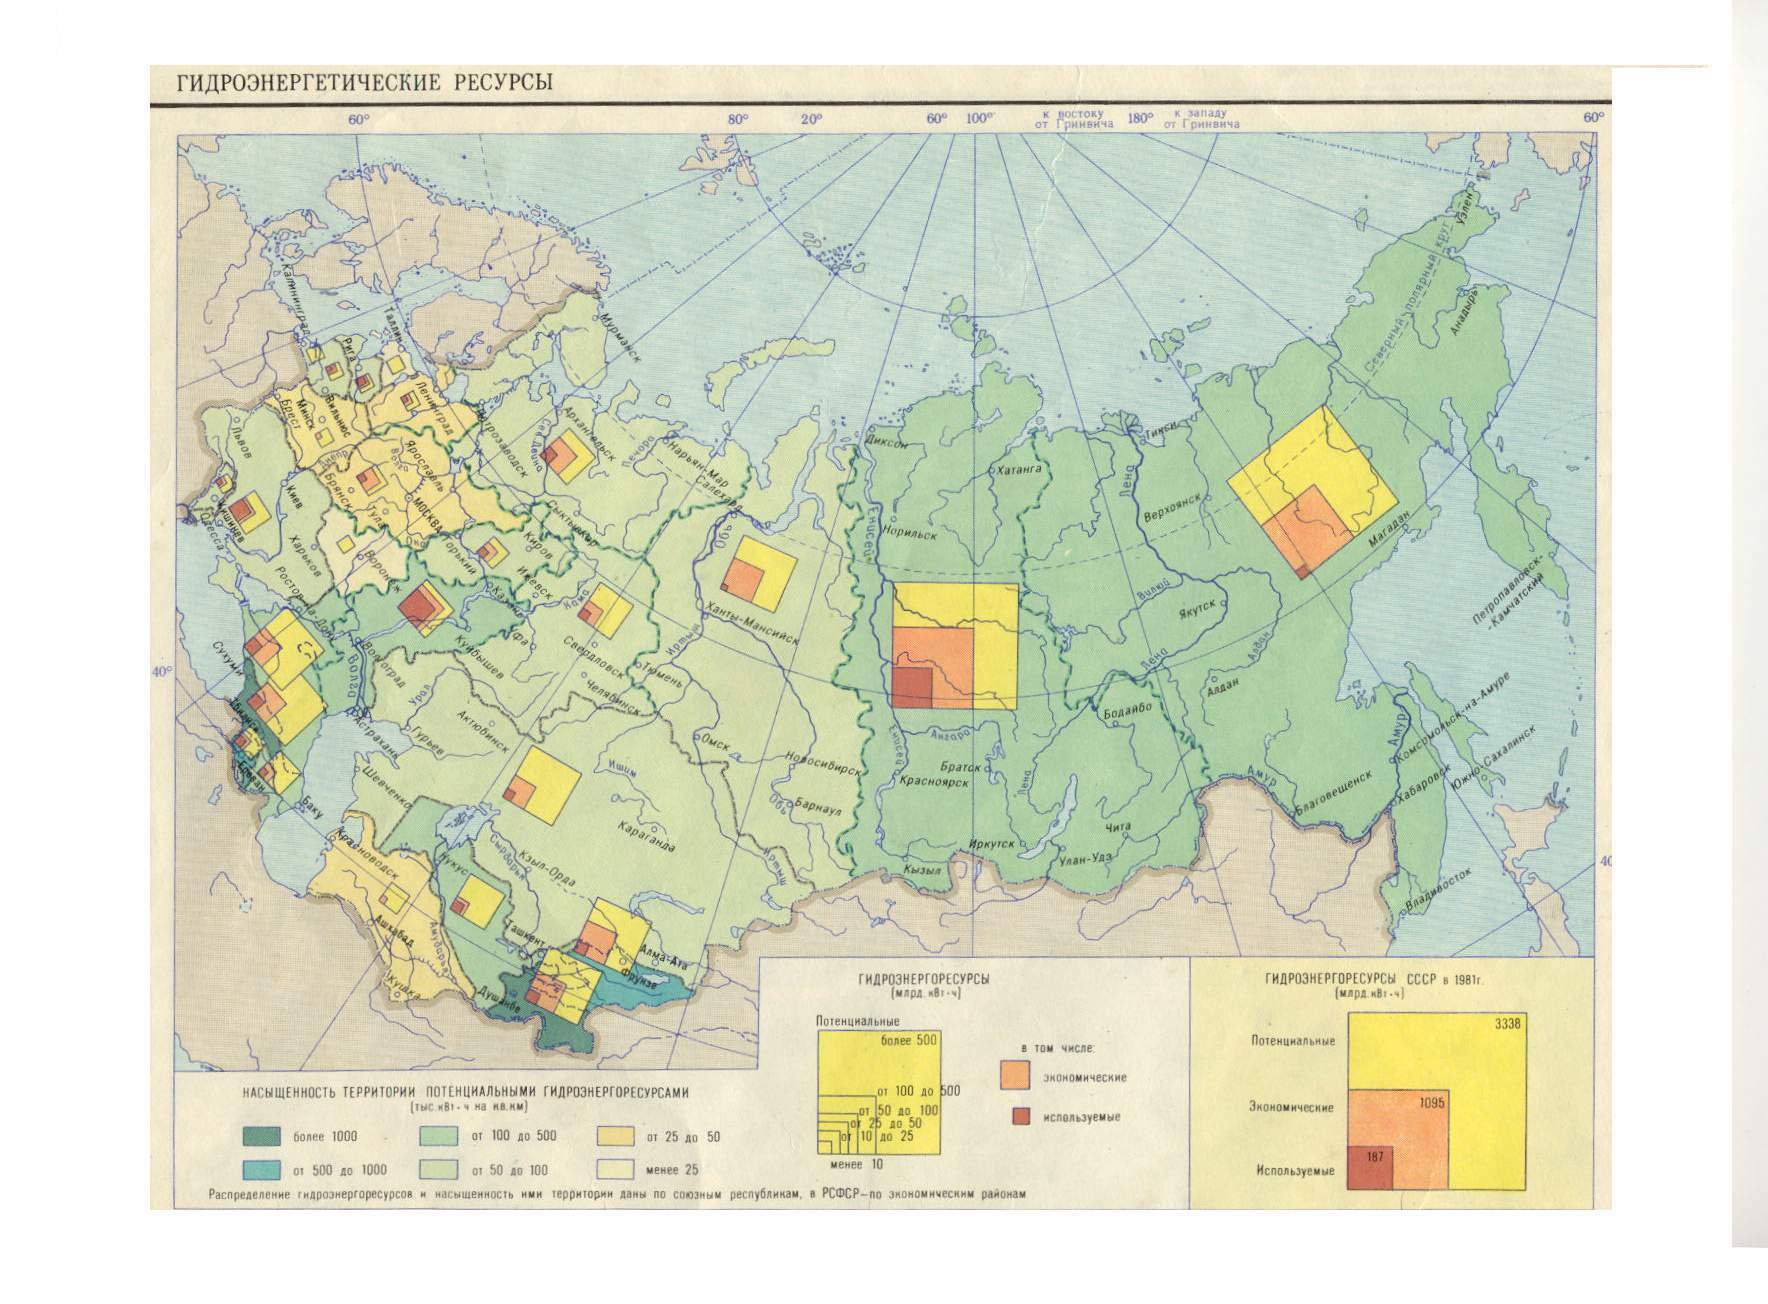
The most popular are: linear diagrams - columns, stripes, etc, which length is in proportion to the comparable values; area diagrams - circles, squares and other geometrical figures which square is in proportion to the comparable values; three-dimensional diagrams - cubes, spheres, etc., which volume is in proportion to the comparable values.
Besides, diagrams can be structural, if they are divided into parts (the same as summarized symbols), according to the structure of the represented event, for example, the composition of lands, structure of export and import.
On the example of linear diagrams correlation of indexes can be seen in the best way, but they are not economical as they take a lot of space at the map. In this meaning squared and tree-dimensional diagrams are preferable, they need less space, as the difference between the largest and the smallest figures is insignificant. Such diagrams are convenient for representing events that have a huge amplitude of maximum and minimal values. But it is very complicated to compare the values of squared and three-dimensional figures by eye, as the differences on the diagram map are smaller than in reality.
Correlation of values can be simplified if they are presented in groups of equal figures (circles, squares) each one represents a particular number of units of the marked event. If several figures are used, and each one of different quantative value, then the method is called "the method of change coin".
There is a principal difference between method of diagrams and method of cartographic symbols, though sometimes they can look very much alike. Cartographic symbols point to the place where the represented objects is located and are not connected with the territorial division. As for the diagrams, they reflect the event that takes place at the territory of administrative or territorial unit.
In should be noted that placement of several equal diagram maps compiled at different time for the same territorial unit allows to trace the change of the event through the time.
On the electronic thematic maps these diagrams, as well as diagrammatic maps can be derived as a hyperlink by clicking the mouse at the interesting territory, you are interested at.