Method of isolines. Pseudoisoline.
Isolines [from Greece "izos" - equal, same] are the lines at the map that pass through the points with the same meanings of some quantitative indexes. For example, well-known contour lines or contours- lines that connect points of the same height that applied to represent the relief at the topographical maps. At first isolines were proposed for the aim of characterizing of the events' size that are continuous and change in the space little by little, for example temperature of air, pressure, height of the Earth surface, amount of precipitations, magnetic declination, etc. Thus lines that connect points with the same index of precipitations are called isohyets (from Greece "hyetos" - rain), lines that connect points with the same magnetic declination are called isogones lines (from Greece "gonia" - angle), etc.
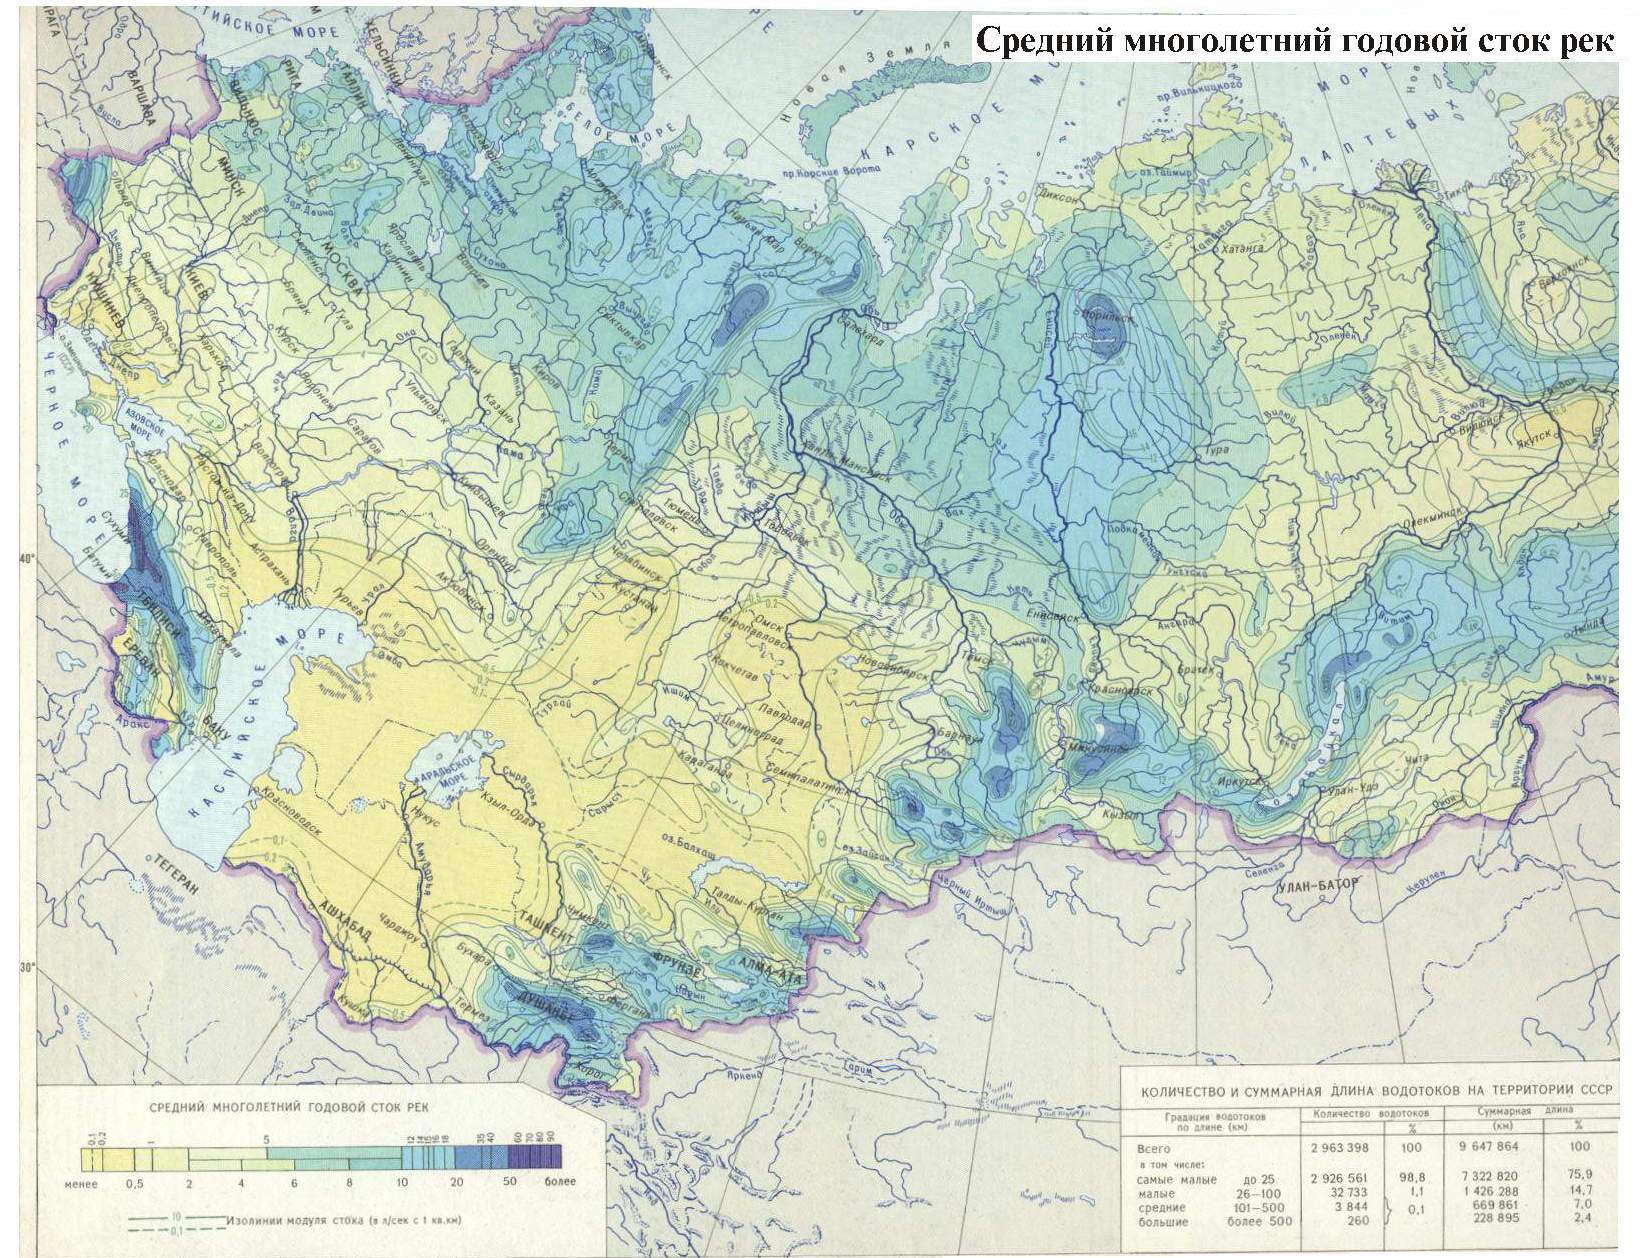
With the help of isolines it is possible to represent not only real events, such as relief of dates of rivers' freezing, but also abstract events such as surface of the precipitations for the year or run-off index per unit of area.
For plotting isolines first one should mark on the map the points for which the indexes of the necessary phenomenon are determined. These points can be situated not only on the earth surface but also above it, for example, for the temperatures at a height of 1000 meters. Then the neighboring points are connected with straight lines. Based upon the fact that the phenomenon changes evenly interim points should be found with the help of interpolation. And these points should be expressed in certain round and whole numbers, which are determined beforehand. Then those fair-curves - isolines can be drawn through the equivalent points.
However even changes of phenomena occur far more seldom than uneven ones. That is why even with the interpolation of common contours between two neighboring altitudes one should consider the different steepness of slopes. Also it is impossible to interpolate the isotherms between the two points separated from each other by a mountain rise. For the correct plotting of isolines especially on the small-scale maps one should take into consideration local peculiarities of the mapped phenomenon, to realize the general regularities of its distribution, and also to consider the relations with other phenomena (for example, relations between the relief and hidrological network, air temperature and relief etc.).
With the use of isolines phenomena are characterized not by separate isolines but by the group of them. That is why it is important to choose the interval between the isolines correctly. It is desirable to keep the interval constant, as the isolines frequency allows visual perception of the direction of the horizontal gradient change. The magnitude of the intervals depends first of all on the range in which the phenomenon values fluctuate. The wider is the range (for example, considerable fluctuations of the relief altitudes), - the larger is the interval, and vice versa. The other factors influencing the magnitude of the interval are the following: the purpose of the map, the detail of the used data and the map scale (the vaster is scale, the smaller is the interval). But for small-scale maps the constant interval can turn out to be disadvantageous in case if territories with large differences in the character of changes of the mapped phenomenon are represented on one map sheet. For example, the interval chosen for the representation of low-lying territories relief gives the busy picture of highlands, and vice versa, the interval chosen for mountainous relief will lead to the depleted representation of a lowland. Gradual increase of sections with the altitude or by zones can solve the problem. Using a variable scale it is important to preserve the isolines that determine qualitative differences in the allocation of the phenomenon. On the relief map one should not forget about the 200-meter contour separating the low-lying part, on the precipitation map - the isolines separating the zones of insufficient, optimal and excess humidification and so on.
The design of isolines is similar to the design of contours: figures are written in the breaks and at the ends of isolines.
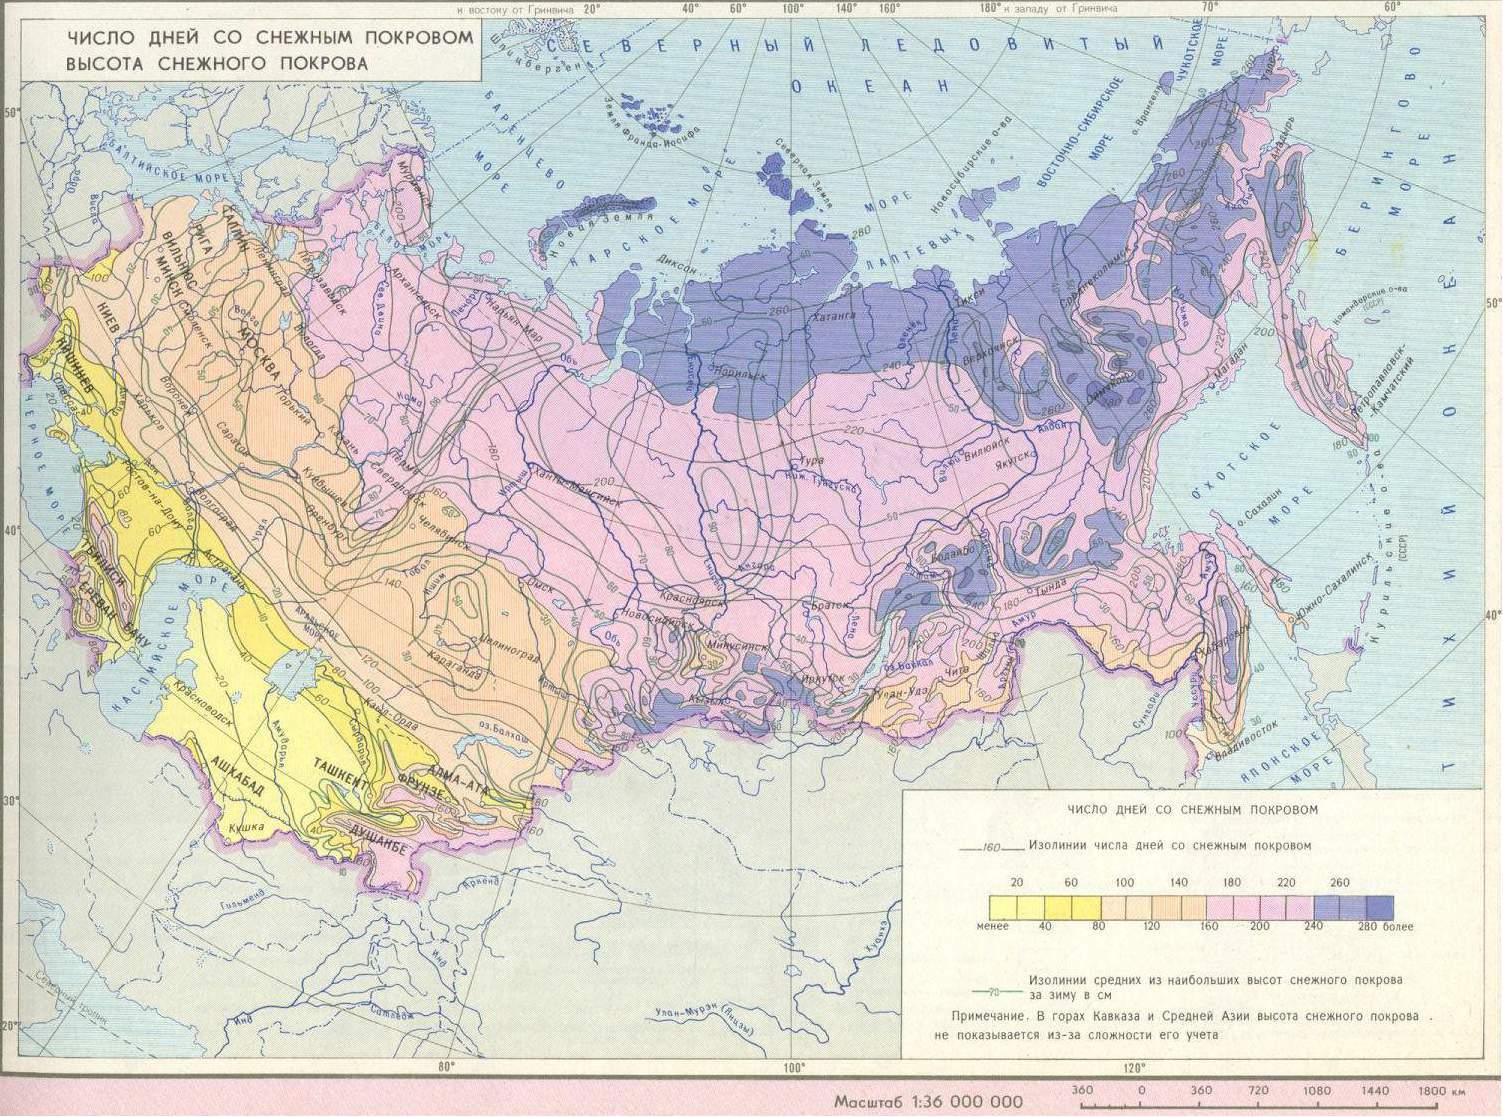
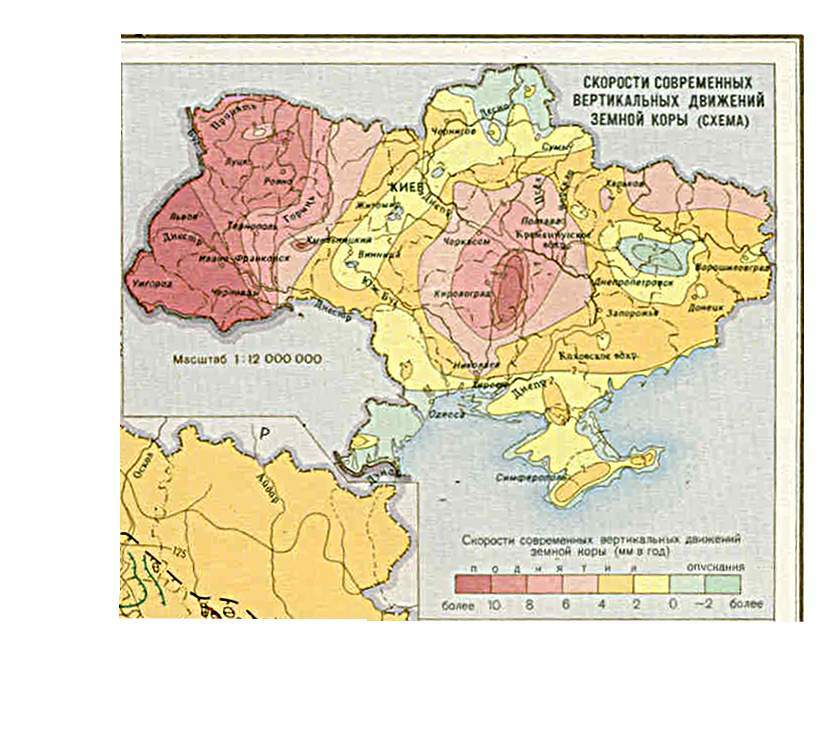
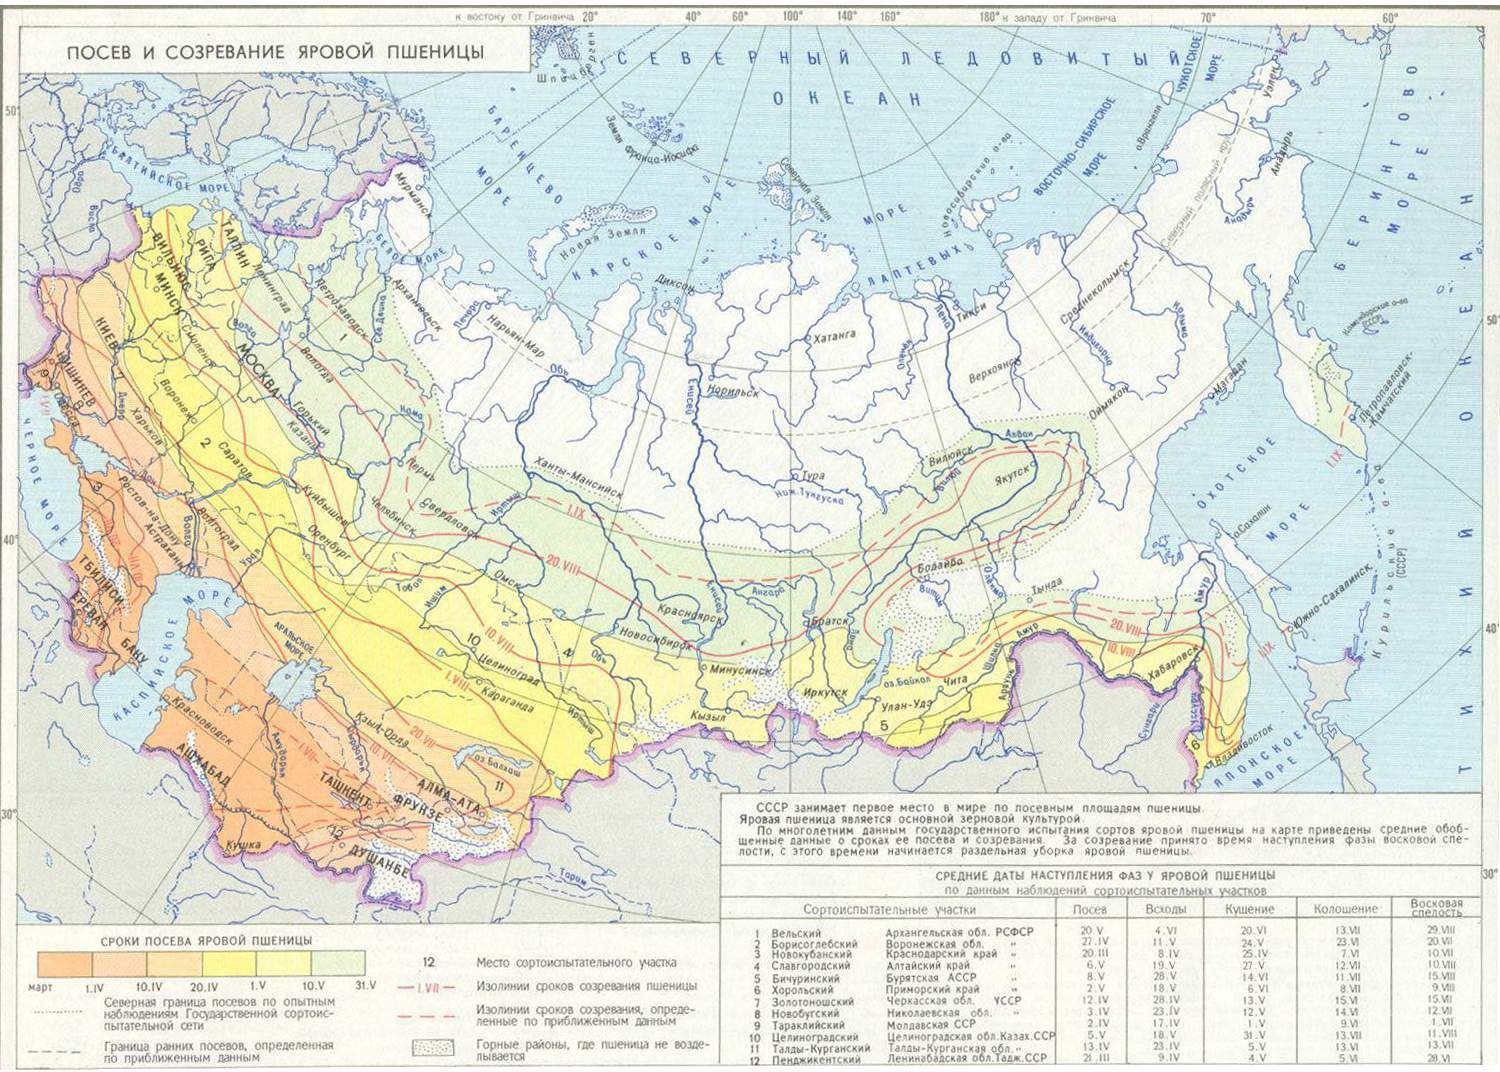
Beside static and quantitative indices isolines are used for characterizing time and dynamic phenomena. With the help of isolines one shows: changes of the phenomenon magnitude within the period of time, for example, the change of the snow depth within the period of several years; spatial transferences, for example, the passage time of a tsunami wave, vertical movements of the earth's crust - the speed of its rise and sinking; the time of the occurrence of a phenomenon by means of isochrones (from the Greek word "chronos" - time), sowing and ripening dates of various crops, efflorescence periods of various plants by means of isophenes, the number of days with snow cover etc.; recurrence (or probability) of phenomena, for example, recurrence of hard wind and storms in different moths of a year.
If a phenomenon (for example, temperature) changes not only in space but also in time, then its value is measured in different points at the definite time or it`s possible to define a certain period of time, for example, the average air temperature at 1 p.m. in August.
Method of isolines is simple and obvious enough, it does not require special explanations in the legend. Moreover it is well combined with other methods of representation and is convenient for creating with the aid of automatic devices. However the use of several isoline systems on one map will decrease its readability for sure.
Isolines are often used for mapping the phenomena that are devoid of solidness and gradualness, this is necessary in case when one needs to emphasize the peculiar density or intensity of a phenomenon. For example, density of population and the percentage of arable lands. In such cases one can use the indexes which relate not to definite points but to the squares of sectors of a certain territorial division (for example, administrative division) or the regular geometric net or some other territorial cells of permanent size, chosen beforehand. For plotting isolines the values of the index are attributed to the geometric centers of sectors or to the points chosen taking into consideration the allocation of the phenomenon within the limits of every square ("centers of gravity"). It is more correct to call this method of representation pseudoisolines. Because in this case the main aspect in plotting isolines (gradual change of values) - loses its force. Let us draw an example: if there must be height marks 470 and 90 meters between the tops of a hill with the height of 750 and 50 meters, than with the change of the density of population within the bounds of the city which equals 750 people per sq. km to the density of population of the adjacent rural district which equals 50 people per sq. km, can be performed by leap. That is why the density of the urban population refers to the center of the city and the density of the rural population refers to the center of the rural district and plotting the isolines of density 470 and 90 people per sq. km between these points proves to be at will. However in this situation the visual perception of the interrelated dispersed phenomena among each other and with continuous phenomena becomes easier. One should bear it in mind that the use of a rare net of territorial subdivision can lead to excessive generalization and distortion of the existing reality.
With the help of animation electronic map allows to show the change of the position of isoline, for example, isotherms, isobars, and to show not only the new location but the dynamic movement with the change of their form.