[Area] This word came from from Latin "area" - - square, space.
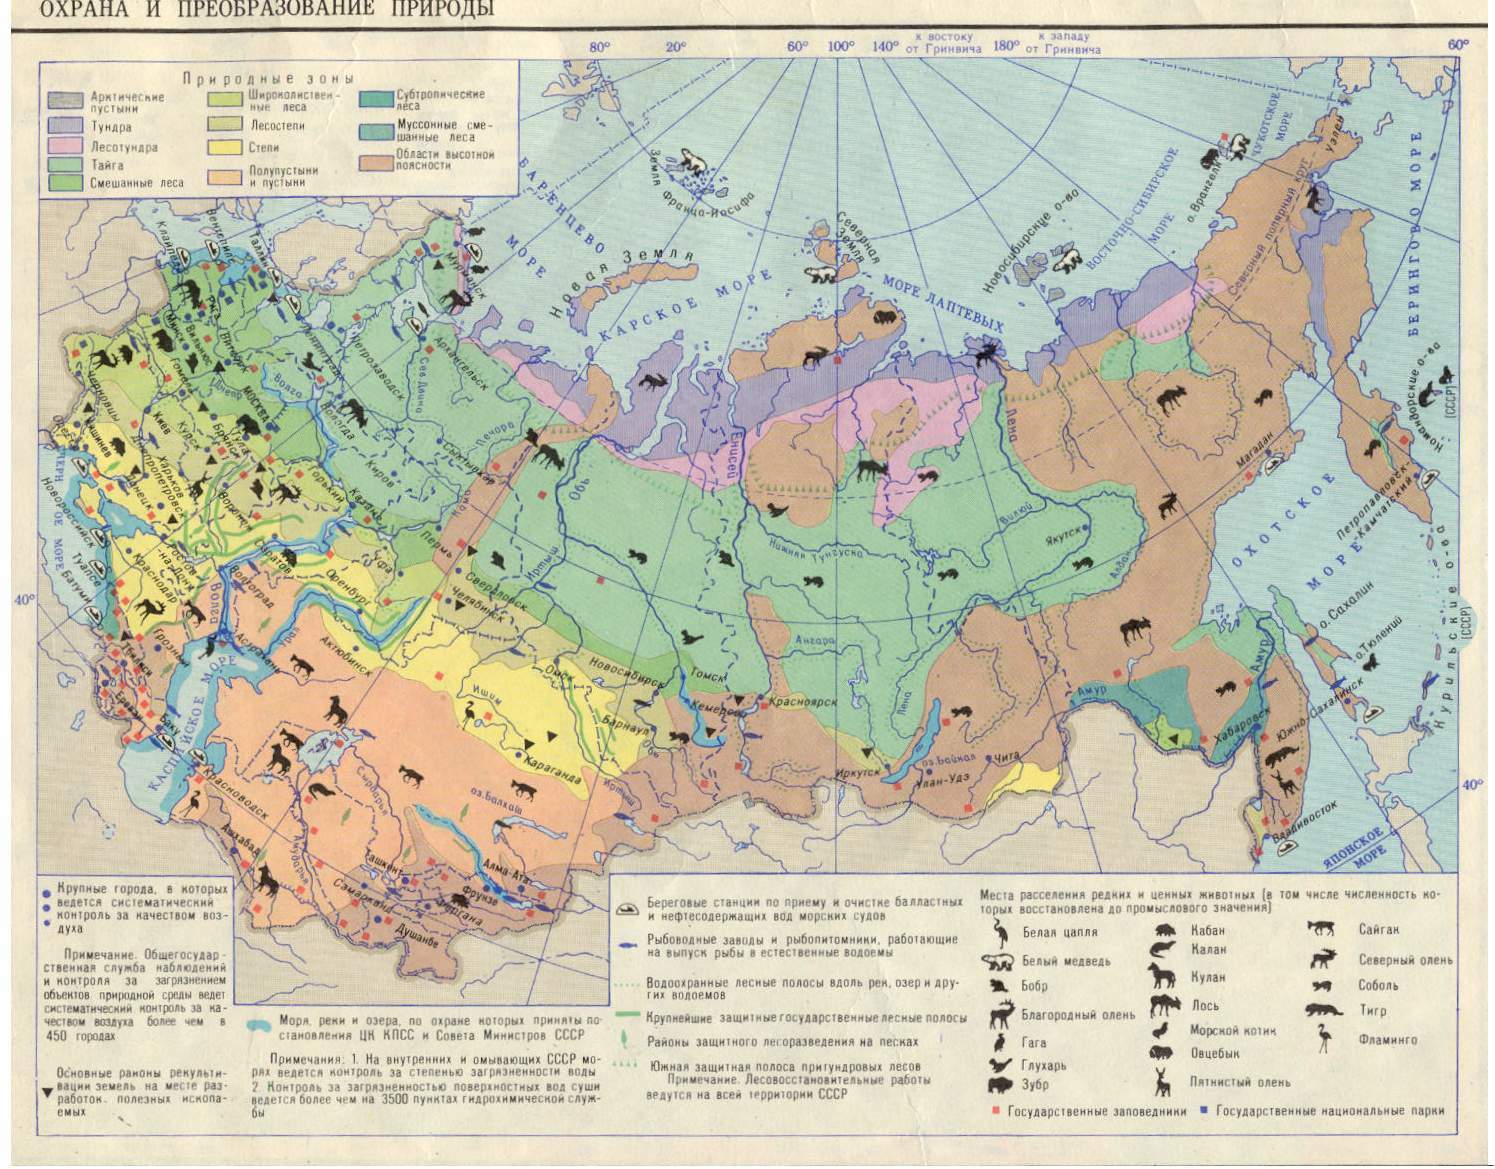
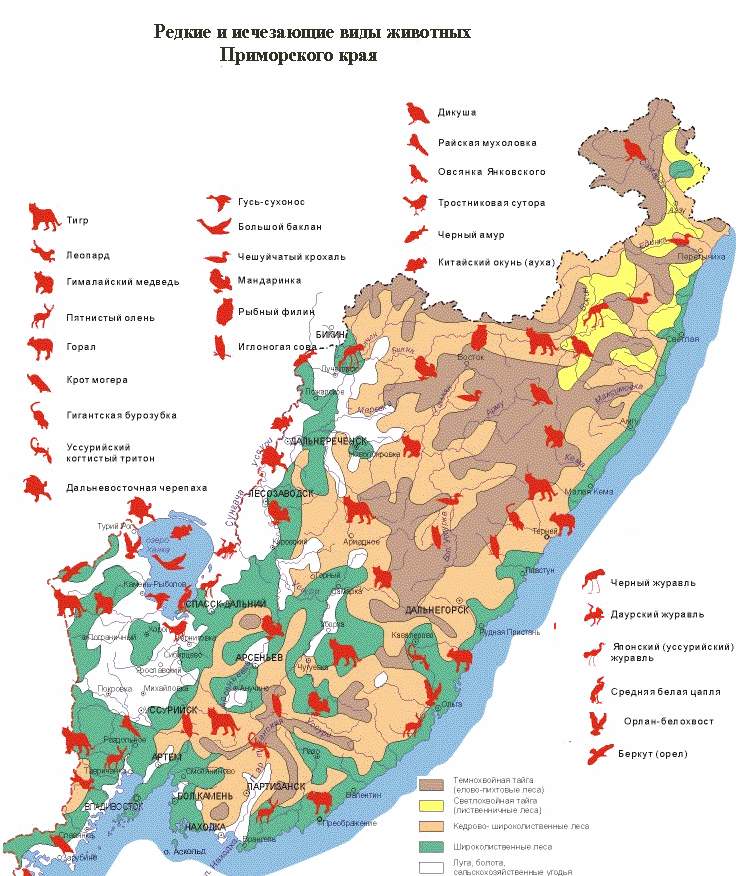
The area is called an area of phenomena spreading, for example, plough-lands, animals or plants. Depending on the character of distribution areas can be uninterrupted, solid (for instance, glaciation) and scattered (for example an area of long-fibred flax cultivation).
An area can be absolute and relative.
Absolute area is an area, outside of which this event cannot be found - for example, some species of animals.
Relative area is a more narrow area covering the territory, where the same event has more particular characteristics, for instance, some species of animals (Siberian weasel, sable) have density of distribution sufficient for hunting.
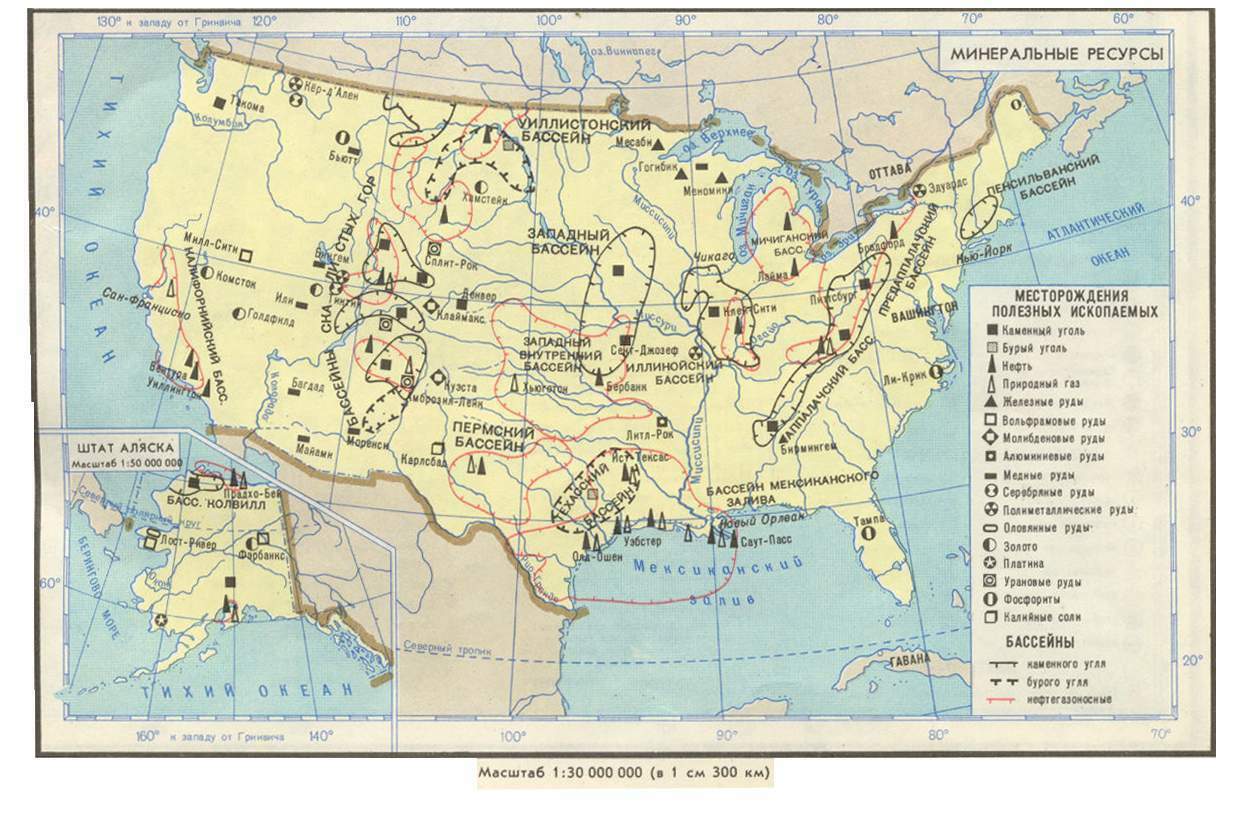
There are various methods to represent areas on the map: limitation of areas with the help of solid or dashed line; coloration of area; hatching of area; proportional accomodation of hatching marks within its bounds, sometimes without indication of area's borders; marking of area with inscription in its bounds; placement of a picture (for example, the symble of fur seal in order to mark the location of fur seals' natural habitat).
If an area is located within the limits of mapping region only partly, then it can be expressed on the map by one open-ended line (for example, the south border of polar fox's natural habitat at the map of Western Siberia). Exact lines of borders are more often used for stable areas' borders; whereas marking without inking is more convenient to use for the schematic areas where an area of phenomena distribution is indicated only approximately. Use of schematic areas can be caused either by poor investigation of the event or by the mobility of these borders in nature (for example, for some species of sea animals). Sometimes according to the purpose of the map areas are schematized for more simple and expressive picture, for instance, on the maps for secondary school.
Very often the approximate representation of areas can be seen at the general economy maps where groups or even separate hatching symbols show the site of phenomenon distribution. Such symbols-areas can resemble signs of character method by their shape, although they are not the same. The symbols-areas mark areas whereas characters presume objects that are localized in "dots". Variety of ways of marking the areas allows to combine on one map several areas in one and the same time even if they cross each other. This can be areas of different phenomenon (various crops) as well as the areas of one event that characterize its inner differences, for example larger or smaller compactness and its fluctuation within the time.
As the main way of cartographical representation method of areas is used at zoogeographical maps that show the areas of inhabitation of some animals and at the flora maps. But mostly this method is used as an additional. For instance, areas of different glaciation, irrigating areas, etc.
In order to mark out the most important and significant areas it is used more large-scaled inscription at the area, thickening of the inking or strengthening of the background's color.
Some areas can be viewed as a special case of isoline or qualitative background. For example if an area coincides with the only isolineor an area characterizes a phenomenon by the qualitative sign.
As for electronic maps the application of areas method can be seen in the way of pulsatoty area that is specially painted in red if this territory should draw a particular attention, for example avalanche-dangerous territories in the mountains. Besides the opportunities of animation application at the electronic maps gives a chance to represent a change of area's location, i.e. its movement, for example, movement of animals' areas, change of geographical shape (its increase or reduction) with the influence of changing ecological conditions. These changes can also be traced from the view of historical development of the events and of the territories.