Besides the traditional methods of the cartographical representation , (cartograms, ęŕđňîäčŕăđŕěěű etc.) created by the laws of Euclidean geometry, there are images, which have in their basis principles of non-Euclidean metricss. We are going to discuss cartoids, "mental" maps and anamorphosises.
Cartoids - abstract graphic representations, while creating them one should not pay attention to the concrete spatial relations, but it`s necessary to show some substantial characteristics - the fundamental essence of the phenomena, conformity to the natural laws of distribution, development of the phenomena and the reasons determining them.
"Mental maps"- graphic representations of the images formed in a brain of the person about objects. They are performed by each of us when we try to explain to somebody how to find a place in city. Thus we build a circuit of a route mentally.
Anamorphosises - the graphic representations, derivatives of traditional maps, which scale is transformed, depending on the value of the characteristic of the phenomena on an initial map.
Origin of the anamorphosises was caused by the necessity to investigate some characteristics, varying in space at the same time. So, if one of the characteristics varying in space can be presented as an evenly distributed, then it is possible to analyze other characteristics connected with it on its background. For this it is possible to transform the image of the phenomenon taken as the base from usual Euclidean metric. Under the term "transformation" we understand a transition from the ordinary cartographic image, usually based on the topographic metric of the Earth surface, to another image, based on a metric connected with the phenomenon under consideration . Process of anamorphosises creation is accepted to call anamorphating. In English speaking countries instead of anamorphosises terms transformed maps, pseudo-cartograms, cartograms, topological cartograms and so on are used. It is possible to allocate linear, area and volumetric among anamorphated images.
Linear anamorphosis often looks like a graph image. Changes of lengths of edges ofit eprmitto change he distances between the regarded units (verticles) depending on values of characteristics taken as a base of the anamorphosis. Example of linear anamorphosis - image of distances from shops to a fixed point of the city, export-import connections of Russia with the countries of the Western Europe etc. The main point for this images is observations of all spatial relations, otherwise they may not be referred to anamorphosises ( for example, statistical graphics for volume of the export-import connections, expressed by columns of various height etc.). Another example which is most accessible to us is a linear anamorphosis the circuit of the Moscow subway lines reflecting the order of stations.
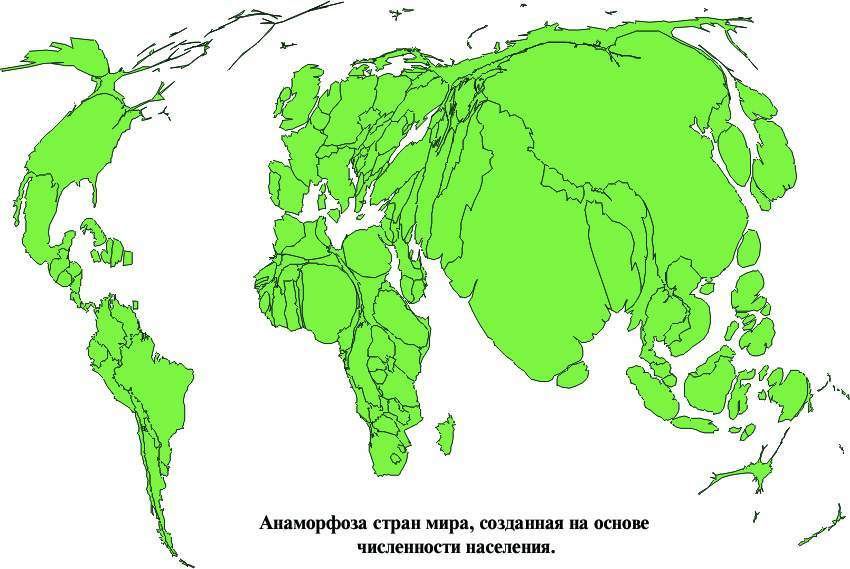
Area anamorphosises are widely spread. They allow to make even different characteristics (for example, population density, territorial distribution of incomes, consumption of some product etc.). Thus the areas of represented territorial units become proportional to the valuesof the parameter from the basis of anamorphosis. And it is important to get the preservation of a relative positioning of territorial units, their forms etc. Equidemic images can be met more often. This images have values of the areas and population proportionate to each other. Anamorphosises with values of incomes of the population, a productivity of agricultural crops, a total national product etc are less often.
3-demention anamorphosises. As is known, classical cartography offers a great number of methods. Color, hatching, conventional signs etc are among them. With the help of the standard methods (for example, column diagrams) many parameters can be expressed simultaneously, - even 30 - 40 ones as it can be reflected on social-economic maps. However presentation of such a map catastrophically falls, and quality of its perception begins to come nearer to quality of table perception on the basis of which it have been created. For this reason various graphic means can be applied for creation. Besides efficiency of a used graphic method is of great importance.
The circuit of 3-d anamorphosises construction is the following. There are 2 parameters requiring for mapping. For example, real GNP and a population of the world. The anamorphosises are created according to a population and GNP, as a result we get 2-dementiom images. Each of them can be used as a basis.
In this case the basis of anamorphosis is represented by the population and GNP on its background. Each country (if it has several contours for each cotour) gets the point, which is considered to be the "center". Choice is conducted visually; the only one necessary condition is that the point must situate within the contours of the country (if the country has several contours - points should be found in each contour). Choice of centre is conducted in cartesian XY system of coordinates on anamorphated image. We give Z=0 to all the points of country border, all the centres gets volue Z equal to GNP parameters. Then according to the set of points, which appeared as a result of previouse actions.Then a new surfase can be created in automating regime (according to Delone method of triangulation) on the base of the points, which have been get. Thus we can get a set of polysided pyramids, which basis will have the same contour as the borders of a country in anamorphosises metrics. The quantity of sides will be equal to the quantity of pionts, chosen on the border line of a country.
Anamorphosises of the world has the following percularity square of each country is propotional to its population. Height of a pyramid is proportional to GNP. As is known volume of pyramid is V=S*H/3, where S -is a square of its basis, H-height of a pyramid. Thus volume of the pyramid is proportional to GNP of the country. But it should be noted that it`s rather complicated to compare volume of GNP of 2 countries visually. As the form of each pyramid is unique, and all of them have irregular form.
The advantages of this method of representation is the effect of the image that it brings. Comparison and extractions of anomalies is facilitated. 2 parameter are reflacted and practically no one of the common cartographical method is used. All the information about 2 parameters contains in its image. Practical volume of anamorphosises is the following. First of all, they are convincing as an illustration, they allow to imagine some facts that are not evident, it`s possible to see some latent conformity to geographical laws. There are some prospects in application for each country (if the country has some loops - for each loop) the point received for its anamorphosises for optimisation of net accomodation in educational institutions, hospitals, service institutions, which must be distributed evenly in artificially equalised space. Then anamorphosises help to make an evident analysis of correlation between phenomena on the background of their characteristics, which have been put for basis of projections.
The additional information on anamorphosises can be looked here: www.geogr.msu.ru/tikunov