Proceedings of the Seminars on Developing the ICA-CET Internet Cartography Course
held at Beijing (China), August 9, 2001 and Helsinki (Finland), May 28, 2002,
published in 2003
Alexey V. Tikunov
Faculty of Geography
M.V. Lomonosov Moscow State University
Vorob'ievi Gori, Moscow 119992 Russia
tikunov@geogr.msu.su
METHOD OF POTENTIALS FOR ANALYZING THE DISTRIBUTION OF
POPULATION AND ITS ACTIVITIES
In this paper we consider different methods of creation of potential surfaces.
There is an analysis of advantages and shortcomings of the method of potentials
and also a few elaborated models are viewed. We represent the short explanation
on how it is possible to calculate world scale potentials of different socio-economic
phenomena. Finally, the simple exercise on the considered subject is given.
In the middle of the 20-th century in order to development of a mathematical
method the concept and the model of potential appeared in a geographical science.
They are borrowed from physics where they are used for the characteristic of
fields of force: gravitational, electric etc. The concept of potential proved
to be rather valuable to geography, which keenly required in an objective parameter
of interactions (connections) in investigated space. As long ago as 1940-th
Baranskij N. N. marked that the distribution of phenomena and interrelations
between them made the soul of geography. But various ways of modeling distribution
are known to geographers for a long time, whereas the analysis of spatial force
connections always stumble on obstacles. It is necessary to stress that even
the analysis of separate isolated connections (for example pairs of homogeneous
objects) is not so simple. As concerns the interrelation of "all objects
with all" few means exist for their revealing and especially quantitative
estimation.
Geographical interpretation of phenomena modeled with the help of this method
usually includes such concepts as spatial interaction, influence, distribution,
gravitation, weight, power, distance, location, availability and so forth. Such
variety and an opportunity of multiple-valued interpretation represent strong
and simultaneously weak side of the potential method. As a whole, the method
was criticized as a version of so-called physicism in the approach to the social
and economic phenomena, which have the essence not reduced to physical one.
On the other hand, nobody argued that these phenomena and its distribution on
a terrestrial surface at least partly submit to the laws similar to physical
one. If, for example, with reference to the population we habitually use such
obviously physical categories, as weight or density, why don't use a number
of others: a field, potential? Why don't admit, that interaction of settlements
creates a field of force that is similar to gravitational and electrostatic
fields?
First time such hypothesis has appeared in 1850-th, when Karei G. S. has tried
to describe interaction of two cities as function of number of their population
and distances between them. But only one century later Stuart J. developed the
concept of potential as a measure of a continuous geographical field and used
it for research of population and service. In 1941-1947 years he published a
number of papers on application of model of potential for the analysis of distribution
of the population. Stuart asserted that people in typical or, at least, in the
certain circumstances submitted to mathematical rules so that reminded an action
of the elementary laws of physics.
The models of potential appeared suitable for the characteristic of the markets,
transport gravitations, migrations and so forth. At that period many attempts
of its mapping were made. There was even a temptation to use potentials instead
of habitual for geography and cartography parameter of density of the phenomenon
(displayed by cartograms).
The concept of potential practically penetrated into geography only in 1960-th
as the accounting machines capable to carry out the toilful computing works
required for calculations at significant number of objects have appeared. However
the "quantitative" boom has passed, and for some time the given concept
was rarely in use. At the same time it is well known that the science, as well
as life, develop cyclically. And nowadays we come back to this method, having
taken advantages of a modern level of automation.
We use the potential method in a world scale and try to prove its imposing appearance,
in particular, in connection with globalization, aggravation of global problems
of mankind, with the growth of attention to irregular development of different
countries of the world. Here we represent not only a new demographic potential,
but also a number of potentials of other social and economic characteristics
in a world scale.
The main goals of the work are to show expediency of application of a potential
method for analysis of the new information on distribution of the population,
wealth and obstacles (costs, social "illnesses" and so forth) of development,
and, simultaneously, to use the method as a way of evident cartographic representation
and visualization.
Social gravitation and its potentials in a number of models and methods
of socio-economic geography
Modeling nowadays is one of the basic methods of modern geography of a society.
It implies the research of a structure, functioning, dynamics of the ideal and
real social and economic phenomena, objects, systems, interrelations and processes
inside them and between them by constructing their conditional models simulating
some key qualities of "original".
Thus, the first substantial assumption is the recognition of presence in social
and economic space and its "layers" (geodemographic, geoeconomic,
geopolitic) such phenomena and laws which conditionally can be interpreted as
gravitational. That they exist, indirectly speaks even the fact of wide introduction
in professional lexicon of such terms as force, influence, gravitation, an attraction
etc. To tell the truth, we often use them as images, some kind of allegories
instead of as strict scientific categories and models. However they, for sure,
reflect some essential sides of interaction between classical objects of socio-economic
geographers (the countries, areas, cities and agglomerations, industrial centers),
being shown in migratory, monetary and commodity flows, in a structure of integrational
and military-political blocks and unions, large (transnational) corporations
with networks of numerous branches etc.
It is obvious, that the model always conducts to simplifications (in reasonable
frameworks), allowing to reveal some main typical features of the phenomenon
and, thus, to give new knowledge about it. Formality of constructions and aspiration
to use its strengths are peculiar to any modeling. Therefore not the substitution
of one method by another, but their mutual addition is expedient in view of
strengths of old, traditional and relatively new methods of research. Methods
of modeling are laid down in a basis of the given work, being used for construction
of digital models of potential and their subsequent cartographic visualization.
Speaking as a whole about application of mathematical methods, it is necessary
to note, that for last decades a great number of parameters, indicators, indexes
of concentration, centre-graphic methods and measures, concepts of an economic-geographical
field, gravitation, form, characteristics of the neighborhood were entered in
a geographical science. The given concepts are constructed by analogy to geometrical
or physical models. The concept of potential is one of them.
The potential models concern to the group of gravitational models of the geographical
phenomena investigating territorial characteristics of structures. Work with
this model assumes the calculation of potential surfaces, analysis and mapping
of their "relief", revealing various forms of relief and especial
nucleus, borders of distribution or potential influence, internal zones, gradients,
peripheral areas etc. The concept of potential came in geography from physics
as analogy to the formula of gravitation of Newton. More precisely speaking,
by virtue of universality of a physical nature (the laws of the mechanics of
Newton and the laws of electrostatics of Coulomb are completely isomorphic),
the given concept has even closer relation to the first law of electrostatics.
It is well known that the formula of Newton expresses the interaction of two
bodies through the product of their weights divided on a squared distance between
them. By analogy to the formula of Newton, force of interaction of two settlements
(that may be expressed in the exchange of migrants, information, passenger or
freight traffics, distribution of diseases) may be written down as follows:
I = (P1P2)/D1-22 (1)
where P1 and P2 - population of the settlements and D1-2
- distance between them. Thus, the potential of interaction ( ) of any point
of territory (j) with all settlements (i) will be expressed as follows:
 (2)
(2)
Calculating demographic potential not for all points of territory, but only
for settlements, it is possible to use the formula:
. (3)
(3)
After such, not accurate, transformation the analogy of settlements to physical
objects becomes a relative one. The problem is not only in this concrete assumption.
It is necessary to admit that the whole "social physics" was criticized
for oversimplification. The reason is that the population, resources, manufacture
etc. are not weights and not electric charges, and physical (geophysical) distances
in social and economic interactions are also "deformed" by the time,
cost of moving, different sort of political, tariff and other barriers all which
concrete variety usually is very difficult to take into account. Nevertheless,
the general principles of interaction in gravitational and electric fields (they
are stronger, when their "agents" are more powerful and when they
are closer each other), most likely, operate also in geosocial fields.
This circumstance or assumption (some simplification is necessary for any modeling)
helps geographers to receive interesting decisions and conclusions. You see
the assumption that the force of interaction of settlements is directly proportional
to their size and is inversely proportional to distance between them, does not
contradict our intuitive representations and it is partly confirmed empirically.
It is remarkable, that the exponent in the gravitational formula (1) among various
researchers varied from 0,5 up to 3,5 and "on the average", as well
as in a lot of concrete cases, was close to 2.
It is important to note the fact, that calculations of potential are especially
cartographic. Maps in this sphere practically have no statistical analogues
(tables, lists). More precisely speaking, such analogues have no sense as results
of work are deprived of presentation, and with it the opportunities to reveal
visible images, forms of statistical "relief".
The calculation of potential according the formula (3) with usage of all settlements
of investigated territory became at the first time the most widespread, almost
traditional method. At the same time the other updatings of calculation of potential
exist and may be useful to the purposes of the applied analysis. In some researches
the design procedure of potential is stated not on settlements, but on countries,
areas, other administrative or statistical units. The population of such cells
in these cases conditionally concerns to their administrative, modal (largest)
or geographical centre. To check up this assumption different maps were designed
on both methods. Their comparison resulted in the conclusion, that "reliefs"
appeared rather similar.
A number of consequences are received if we use formula (3) for calculation
of potential where the total potential is submitted as the sum of the self-potential
equal to weight (for example, population) of a point and the external induced
potential, that is a measure of position produced by external for the given
point forces (settlements). For large settlements it results in sharp increase
of value of potential only due to their own weight. In connection with this
there are offers to calculate potentials for settlements without taking into
account their own population.
It is important to note, that at calculation of potentials as parameter P (formula
3) may be used not only population of points (it is the most traditional example),
but also certain other parameter. It is necessary, that it conditionally could
be compared to weight or a charge (amount of electricity) in its interaction
with other objects. It is possible to apply different methods also when we take
into account the distances. Usually they take the direct ("air") distances
calculated as increments of coordinates. Sometimes such simplification is inappropriate,
because there are no basic obstacles that can not allow to take into account
the real length of ways, time or money spent on overcoming of the way etc. The
mentioned factors are especially important for those areas where the roads connecting
settlements, enterprises etc. have a difficult configuration (for example, because
of complexity of a relief and other environment). However, it is necessary to
admit, that the calculation of potential in view of a real network of roads
is extremely labour-consuming.
For this purpose the method using electric modeling on grids of resistors may
be offered. So, between the formula of influence of any point i on any point
j:
 (4)
(4)
and the law of the Ohm:
I = U/R (5)
it is simple to establish analogy that allows to apply electric analog circuits
to construct maps of potential of different parameters. So, the network of roads
is modeled by a set of resistors, the size of resistance (R) is proportional
to the length of ways, their throughput, speed of movement along them, time
spent in a way etc. On the constructed model the electric voltage (U), proportional
to the weight of points (P), is put serially to points i. And in the point j
values of force of a current (I) are measured, then they are summarized and
give final value of potential. This operation is repeated for each point.
At the same time, it is obvious, that the degree of detailing of calculations
should correspond to the width or narrowness of the content of the research,
spatial scale and degree of generalization of constructions. So, for example,
it is not meaningful to specify and concretize parameter of distance, bringing
it under the rigid transport circuit if the task is to work out the general
demographic or manufacturing potential on extensive space where for different
kinds of interaction (streams) different route networks and types of transport
can be used.
Discussing different methods of elaboration of potential models, it is necessary
to pay attention to the fact, that the full potential, which value includes
self-potential of "meaning points", is often used as a model for revealing
forms and structures of the geographical phenomena. But, it automatically, due
to the account of interposition of weights of objects (the induced component)
and its continuity, generalizes these forms and structures. Such automatism
makes it less dependent from a configuration and even density of an initial
network of points or cells used in calculations. The given property is especially
appreciable in comparison with those more traditional models, for example, cartograms
of population density, which operate with discrete sites and do not take into
account their interposition, and generalization is reduced to arithmetic averaging
of parameters in frameworks of more and more extensive cells (the countries
instead of its regions, continents instead of the countries etc.).
Calculations of world scale potentials
In our case, as it is usually done, the presentation begins with calculation
of demographic potential. Then on its basis the calculations of potentials of
other phenomena and regional fragments of the world are conducted. Generally
for the whole Globe such computations have no reflections in the accessible
literature (if they have ever been undertaken). Meanwhile, this scale has specificity
and complexities that are necessary to take into account.
Utilizing a great number of points (for calculations at a world scale the basis
consist of about more than 20 thousand settlements) the own population of settlement
adds in value of potential rather small share in comparison with its basic part
represented by total induced potential of the other points. The exception, undoubtedly,
is the value of potential nearby very large cities.
At calculation of potentials for separate regions the question of a choice of
territorial frameworks of external forces (agents of influence) is very important,
and their boundaries, as the common rule, are not limited to territory of mapping
of potential surface. The points included in calculation may or even should
be situated far beyond the mapped site. It is obvious, that this choice is caused
by the purpose, for which the potential is calculated and mapped. So, the maps
of demographic potential of small area, but designed in view of influence of
all country, continent or the whole world, have valuable property: they are
comparable for different such areas as in all cases the aggregate number of
the external population included in calculation is identical. Otherwise each
map has its own system of readout of potential. Applying method of potentials
to various on scales but overlapped territories, it is possible to allocate
their own potential and influence of near and distant neighbors.
This external influence is displayed by the induced potential. It is frequently
interpreted as a measure of potential of the unequal geographical position of
territory, and the word "potential" itself gets in this case the additional
sense connected to representation about geoposition as a potential source, a
resource of development.
Technically the surface of induced potential can be achieved if to calculate
potential using the standard method, but the weight of all points of considered
territory to equate to zero, receiving for them values of potential only induced
from behind its limits. The same result can be achieved, if from the full statistical
surface of potential (the territory itself and adjoining territories) to subtract
the surface formed by points of the considered region itself.
The calculations of the induced potentials (especially at the big number of
considered points) are more convenient to make not in the points of the concrete
network, but in tops of any correct geometrical network, for example, network
of squares put on the map. Just this method is used in the given work. There
are a number of arguments (Tikunov, 1997 etc) proving that such method is even
more correct at calculation of potential for any point of territory.
Calculation of potential on a regular network leads to the results close to
those received with the help of other methods, however the time of made calculations
reduces. The reason is the calculation of distances not from each point to any
other, but from points to units of the network. The most essential difference
in case of calculations on regular lattice is the fact that large settlements
are not allocated so boldly on the average background of potential surface,
as in the case when we use the traditional technique. At the calculation of
the induced potentials, both on a regular lattice and on the basis of the real
network of points, distinctions of the corresponding maps appear even more insignificant.
At calculation of potential surfaces with the usage of correct geometrical networks
it is possible to occur that the unit of a network will be situated very close
or even exact on a place of settlement. In this case, when the distance between
the unit of the network and settlement is equal to zero, calculation under the
formula (2) used for such calculations, results in uncertainty (to infinity
in a relief). The formula (3), when at the calculation of potentials this obstacle
is overcome by not very reliable addition to value of potential the weight of
the point for which this calculation is carried out, is also not quite perfect.
For the decision of this problem, for example, Frolov (Frolov, 1975) offered
the design procedure eliminating formality of reference of all population of
settlements to their centers by approximation of settlements not by points,
but by equal to them circles with in regular intervals distributed population
density.
In this paper a little bit other way was applied (the formula (6)), but as a
matter of fact it is rather close to the logic of abovementioned variant:
 (6)
(6)
The grid of cities with the population more than 10-20 thousand inhabitants
(more than 20 thousand settlements in total) is utilized as a basis of settlements.
The data on population of the cities were taken from the site http://www.gazetteer.de.
It is necessary to note, that the received grid can be hardly considered homogeneous,
because for a number of the small (I mean their population) countries the settlements
with the population more than one thousand persons were taken into account whereas
for such large countries as China or India the qualification of minimal population
was up to standard of 25-30 thousand. However in the world scale the abovementioned
distinctions hardly played an essential role, especially if to take into account
the fact that in result we used the total population of the countries and not
just that its part which fell to the mentioned points (about it we shall tell
later).
For better automatic calculations (as it has been already spoken above, the
usage of the given method doesn't result in losses of the information) the regular
network, which units were all crossings of parallels and meridians with the
step in 1 degree, was taken.
It is necessary to note that the total population of the countries was taken
into account in the potential models. The agricultural population, which for
the world on the average is about 50 %, was included in considered models under
the simplified circuit. The agricultural population was distributed in accordance
with its share in each separately taken country and added to the population
of the settlements (that we use as basic points) proportionally to their size.
Thus, it is possible to speak about the population living in the settlements
bigger than 10-20 thousand persons and about all the rests, which geographical
variations are taken into account at the level of the whole countries and in
their borders repeat distribution of the population living in the settlements
of the specified size.
In protection of this method it is possible to adduce the statements of Stuart,
the founder of method of potential. In 1947, proving application of this method,
he referred to four empirically deduced rules. First of them is known as a rule
"the rank - the size" (this rule connects the number of population
in any city with its rank in the system of distribution of settlements and with
the size of the largest city). According to the second rule confirmed on the
example of the USA, the number of the cities with the population less than 10
thousand persons practically corresponds to the share of the population living
in the given group. In the third rule it is confirmed that the distribution
of the population over the territory may be described through demographic potential
in a number of points like the same as the magnetic potential is described in
physics. The fourth rule establishes the close interaction between demographic
potential and density of agricultural population.
Thus, consideration of various methods of creation of potential surfaces allows
exposing the following basic conclusions and assumptions, adhering which it
is possible to carry out correct calculations, in particular in a global scale:
1. There is an opportunity of calculation of potential surface on the basis
of geographically selective statistics (only the cities of the definite size)
that reduces the volume of computing works. Generally, it is necessary to use
this opportunity very cautiously, not overcoming some limits. For more accurate
calculations on the limited territory in large cartographic scale sometimes
it is necessary to use all settlements. However such method may hardly deform
the planetary picture.
2. Calculation of potential on the regular network of reference points is quite
well-founded methodically, because emphasizes the continuity of the potential
surface, suits better for automated interpolation of isopleths etc. This method
has the shortcoming inherent to all methods using regular networks for calculation.
I mean complexity in the choice of the optimum size of the network and ambiguity
of the decision, its dependence on how this network to arrange on the map. But
at practical calculations of potential the divergences may be absorbed due to
intervals of the scale of isopleths and make no influence at the final result.
Examples of world scale potentials
As it was already mentioned, the creation of potential surfaces is possible
on the basis of various social and economic characteristics. However it is necessary
not to forget one limiting condition (according to the approach used in the
concrete work): it is necessary that the parameters have close relation to the
population as its differentiation is incorporated in the basis of the model.
If to break the mentioned principle, the potential surface within the framework
of each separate country will lose any sense, though the global structure will
be basically realistic. All taken parameters do for the mentioned rule - population
for two dates (1950 and 2000), average annual rate of change of population,
GNP per capita, estimated number of people living with AIDS.
For the demographic potential, which was designed for two dates (1950 and 2000),
we used the abovementioned method. Calculating other models, the surface of
demographic potential, which values in each settlement of the basic network
were taken, was increased on an average national value of considered parameter
for any separate country. By this simple operation the world potentials of other
characteristics were obtained, though inside any separate country, even in extensive
one, its variation was relative and simply repeated the differentiation of the
population.
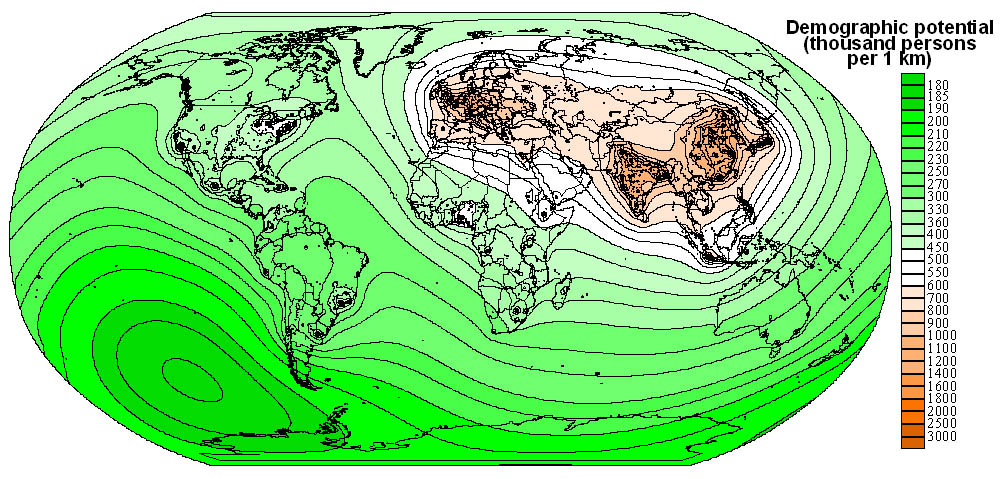
Fig. 1. Demographic potential, 1950.
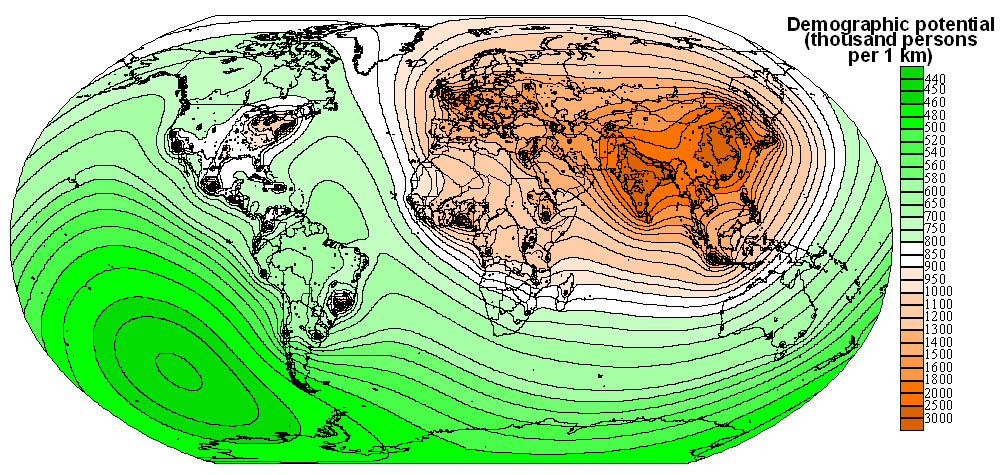
Fig. 2. Demographic potential, 2000.
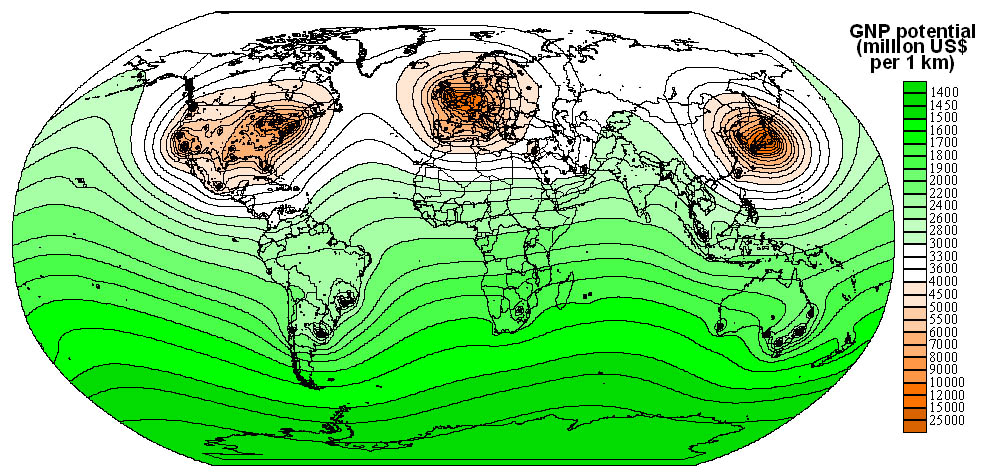
Fig. 3. GNP potential, 2000.
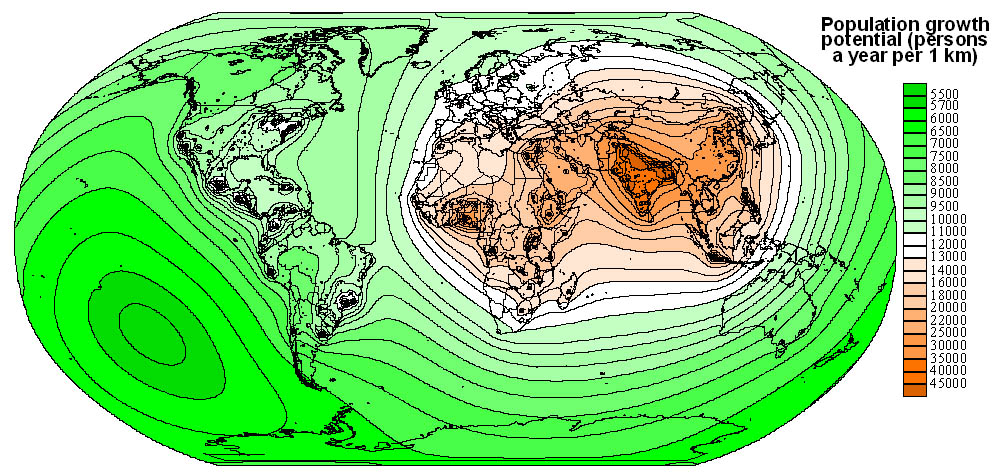
Fig. 4. Population growth potential, 2000.
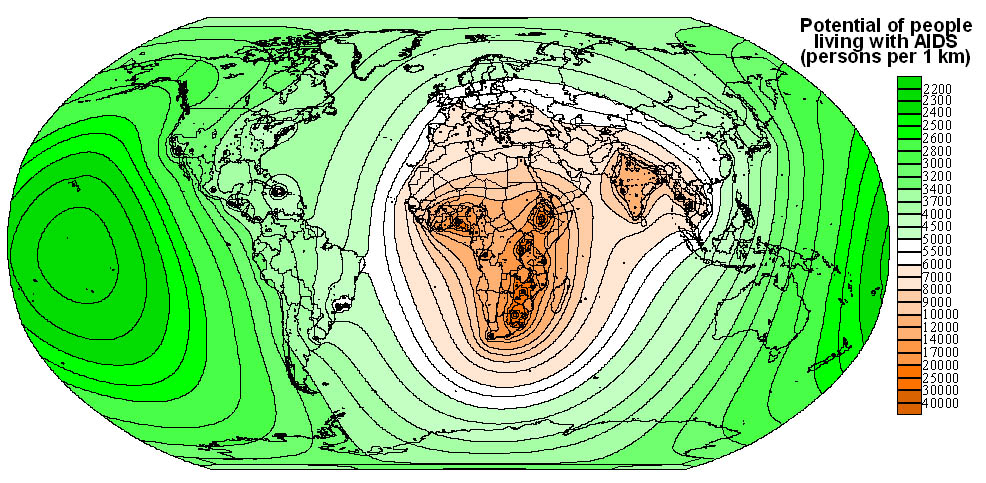
Fig.5. Potential of people living with AIDS, 2000.
The exercise: population and transportation potentials - deciding on an
optimal location
A, B, C, D, and E represent five different population centres. Population of
each is given bellow (tab. 1). Roads of two different qualities connect all
these settlements. The differences will, of course, affect the transportation
cost. The single lines represent two-lane highways and the double lines represent
divided highways. The divided highways offer easier, less congested transportation.
Because of this difference and for a given cost, cities connected by the less
efficient two-lane highways can ship only half of the amount of goods compared
to those connected by the divided highways. That is, with some assumption, the
interaction between the two cities will be the same as if the distance between
them were doubled. Therefore, you will have to make an adjustment when you calculate
transportation and population potentials. For the sake of simplicity, do this
by doubling the distance between centers connected by two-lane highways. For
example, the two-lane highway of length 20 miles connects X and Y. To simulate
the transportation difficulty, for calculation purposes only, double the distance
to 40 miles. When determining the path of travel between any two cities use
the actual distances on the map and choose the shortest route. In other words,
do not double the distances when you are selecting the shortest path.
The objective of this exercise is to find the best location for serving the
cities, which make up the market by using the demographic potential and transportation
potential models. The optimum place will be the one with the highest positive
difference between the two potentials.
Demographic Potential = 
Transportation Potential = 
Assumptions:
1. Tastes or preferences do not vary from one place to another.
2. Assembly and production costs are the same throughout the area. Therefore,
the price of a good will be a function of the distance it is shipped.
3. The shortest actual route (not adjusting for road type) between two cities
will always be taken.
4. When i = j, use a value of 1 for the distance (e. g.,Daa = 1). That
is, the distance between a place and itself is considered to be 1.
In order to compare the two values (jVi and jTi) for each city, convert
the values to percentages. The highest value will represent 100%, and the others
will be calculated as a percentage of that value.
Tab. 1. Demographic and transportation potentials.
|
City
|
Population
|
jVi
|
Percent
Value
|
jTi
|
Percent
Value
|
Difference
|
|
A
|
600 |
|
|
|
|
|
|
B
|
425 |
|
|
|
|
|
|
C
|
800 |
|
|
|
|
|
|
D
|
625 |
|
|
|
|
|
|
E
|
400 |
|
|
|
|
|
Fig. 6. Configuration of the territory.
Indicate the city, which has the best location, from which to serve the other
cities in the study area. The larger the positive difference between these two
potentials, the better.
References
Cliff A. (1979) Quantitative methods: spatial diffusion. // Progr. Hum. Geogr.,
3, ? 1, pp. 143-152.
Gudjabidze V. V. (1972) Demographic potential as a measure of distribution of
population. // Vestnik MSU, ?2, pp. 98-100.
Evteev O. A. (1969) Demographic potential map as a specified characteristic
of distribution of population. // Vestnik MSU, ?2, pp. 72-76.
Pravda J. (1984) Some Problems in Cartographical Interpretation of Geographical
Space. // Geograficky casopis, ? 4, pp. 14-32.
Skoda L., Robertson J. C. (1972) Isodemographic map of Canada. // Geogr. Pap.
Lands Dir. Dep. Environ., ? 50, VIII, pp. 34-67.
Tikunov V. S. (1997) Modeling in cartography. M., MSU.