Method of cartographic symbols.
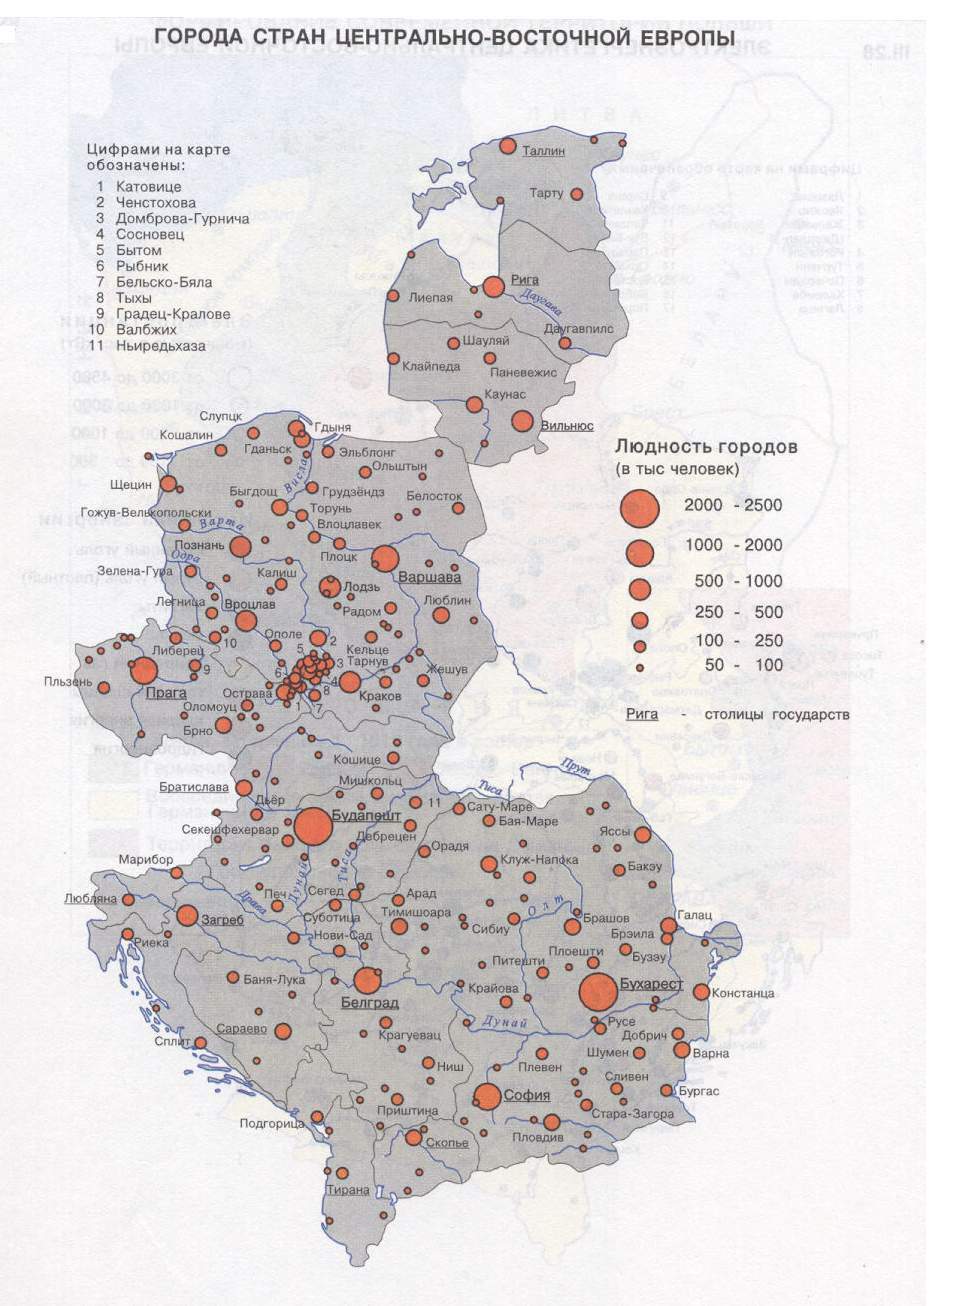
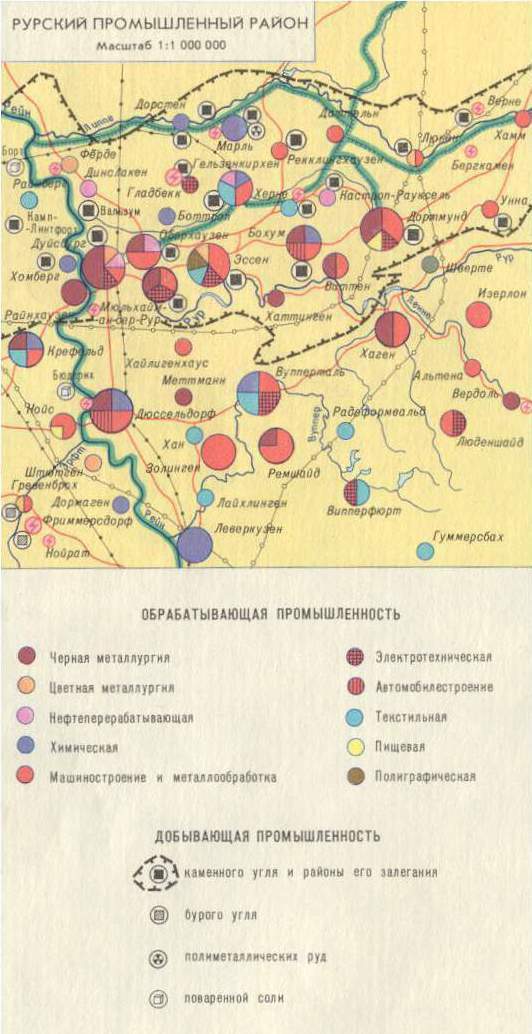
Method of cartographic symbols is used for marking objects that are not distinguished in the scale of the map or having smaller area than cartographical symbol, as well as for marking objects that are localizated in the particular points. On the thematic or geographical maps of the small scale cartographic symbols mark not only the location of an object but also its size, meaning and its transformation within the time. For example, symbol of the settlement can mark type of the settlement (city, urban village, village, etc.), quantity of the population and its administrative meaning. This type of representation is used mainly for representation of the cities, industrial plants and mineral deposits.
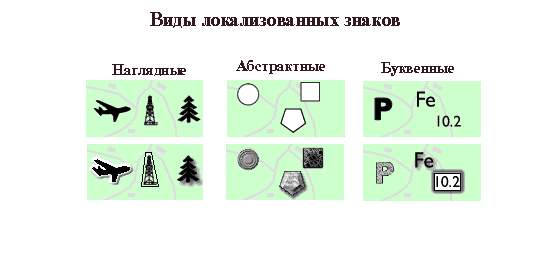
By their shape all symbols can be abstract, in letters and visual.
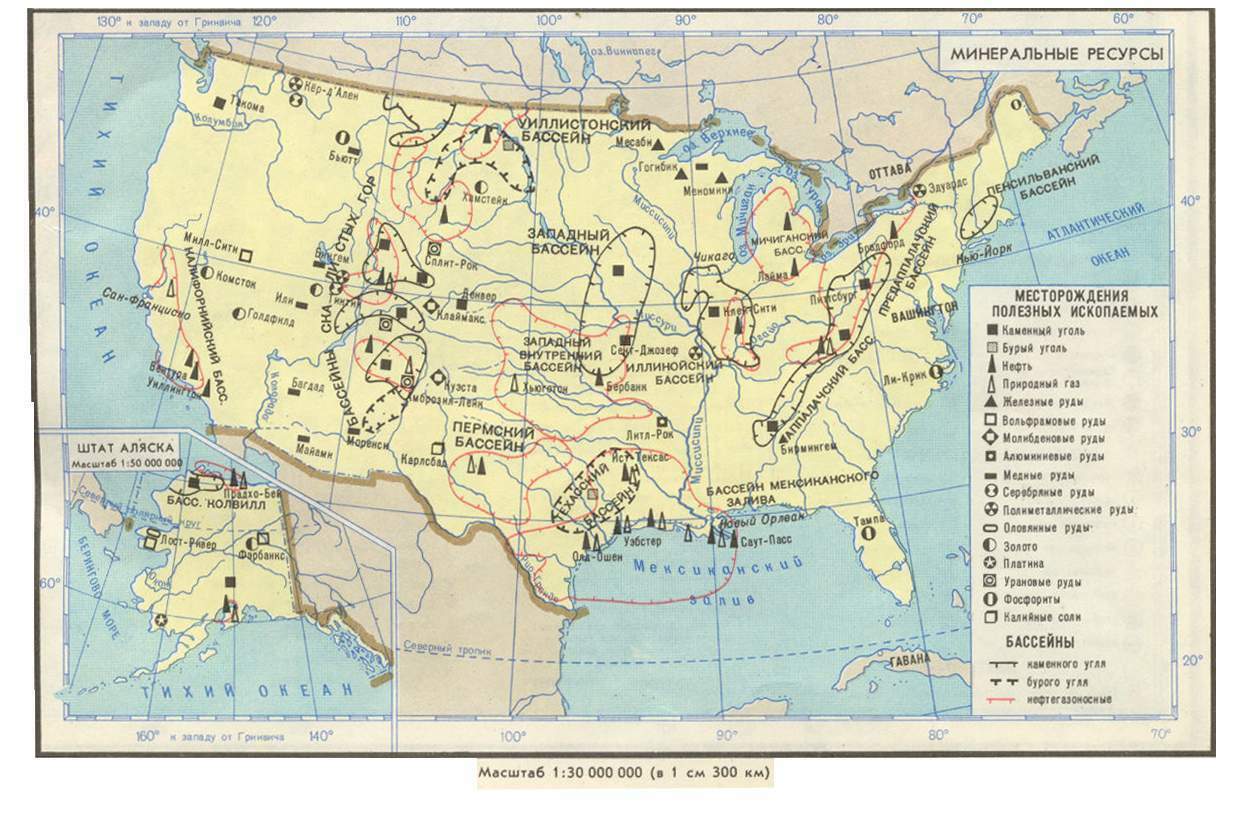
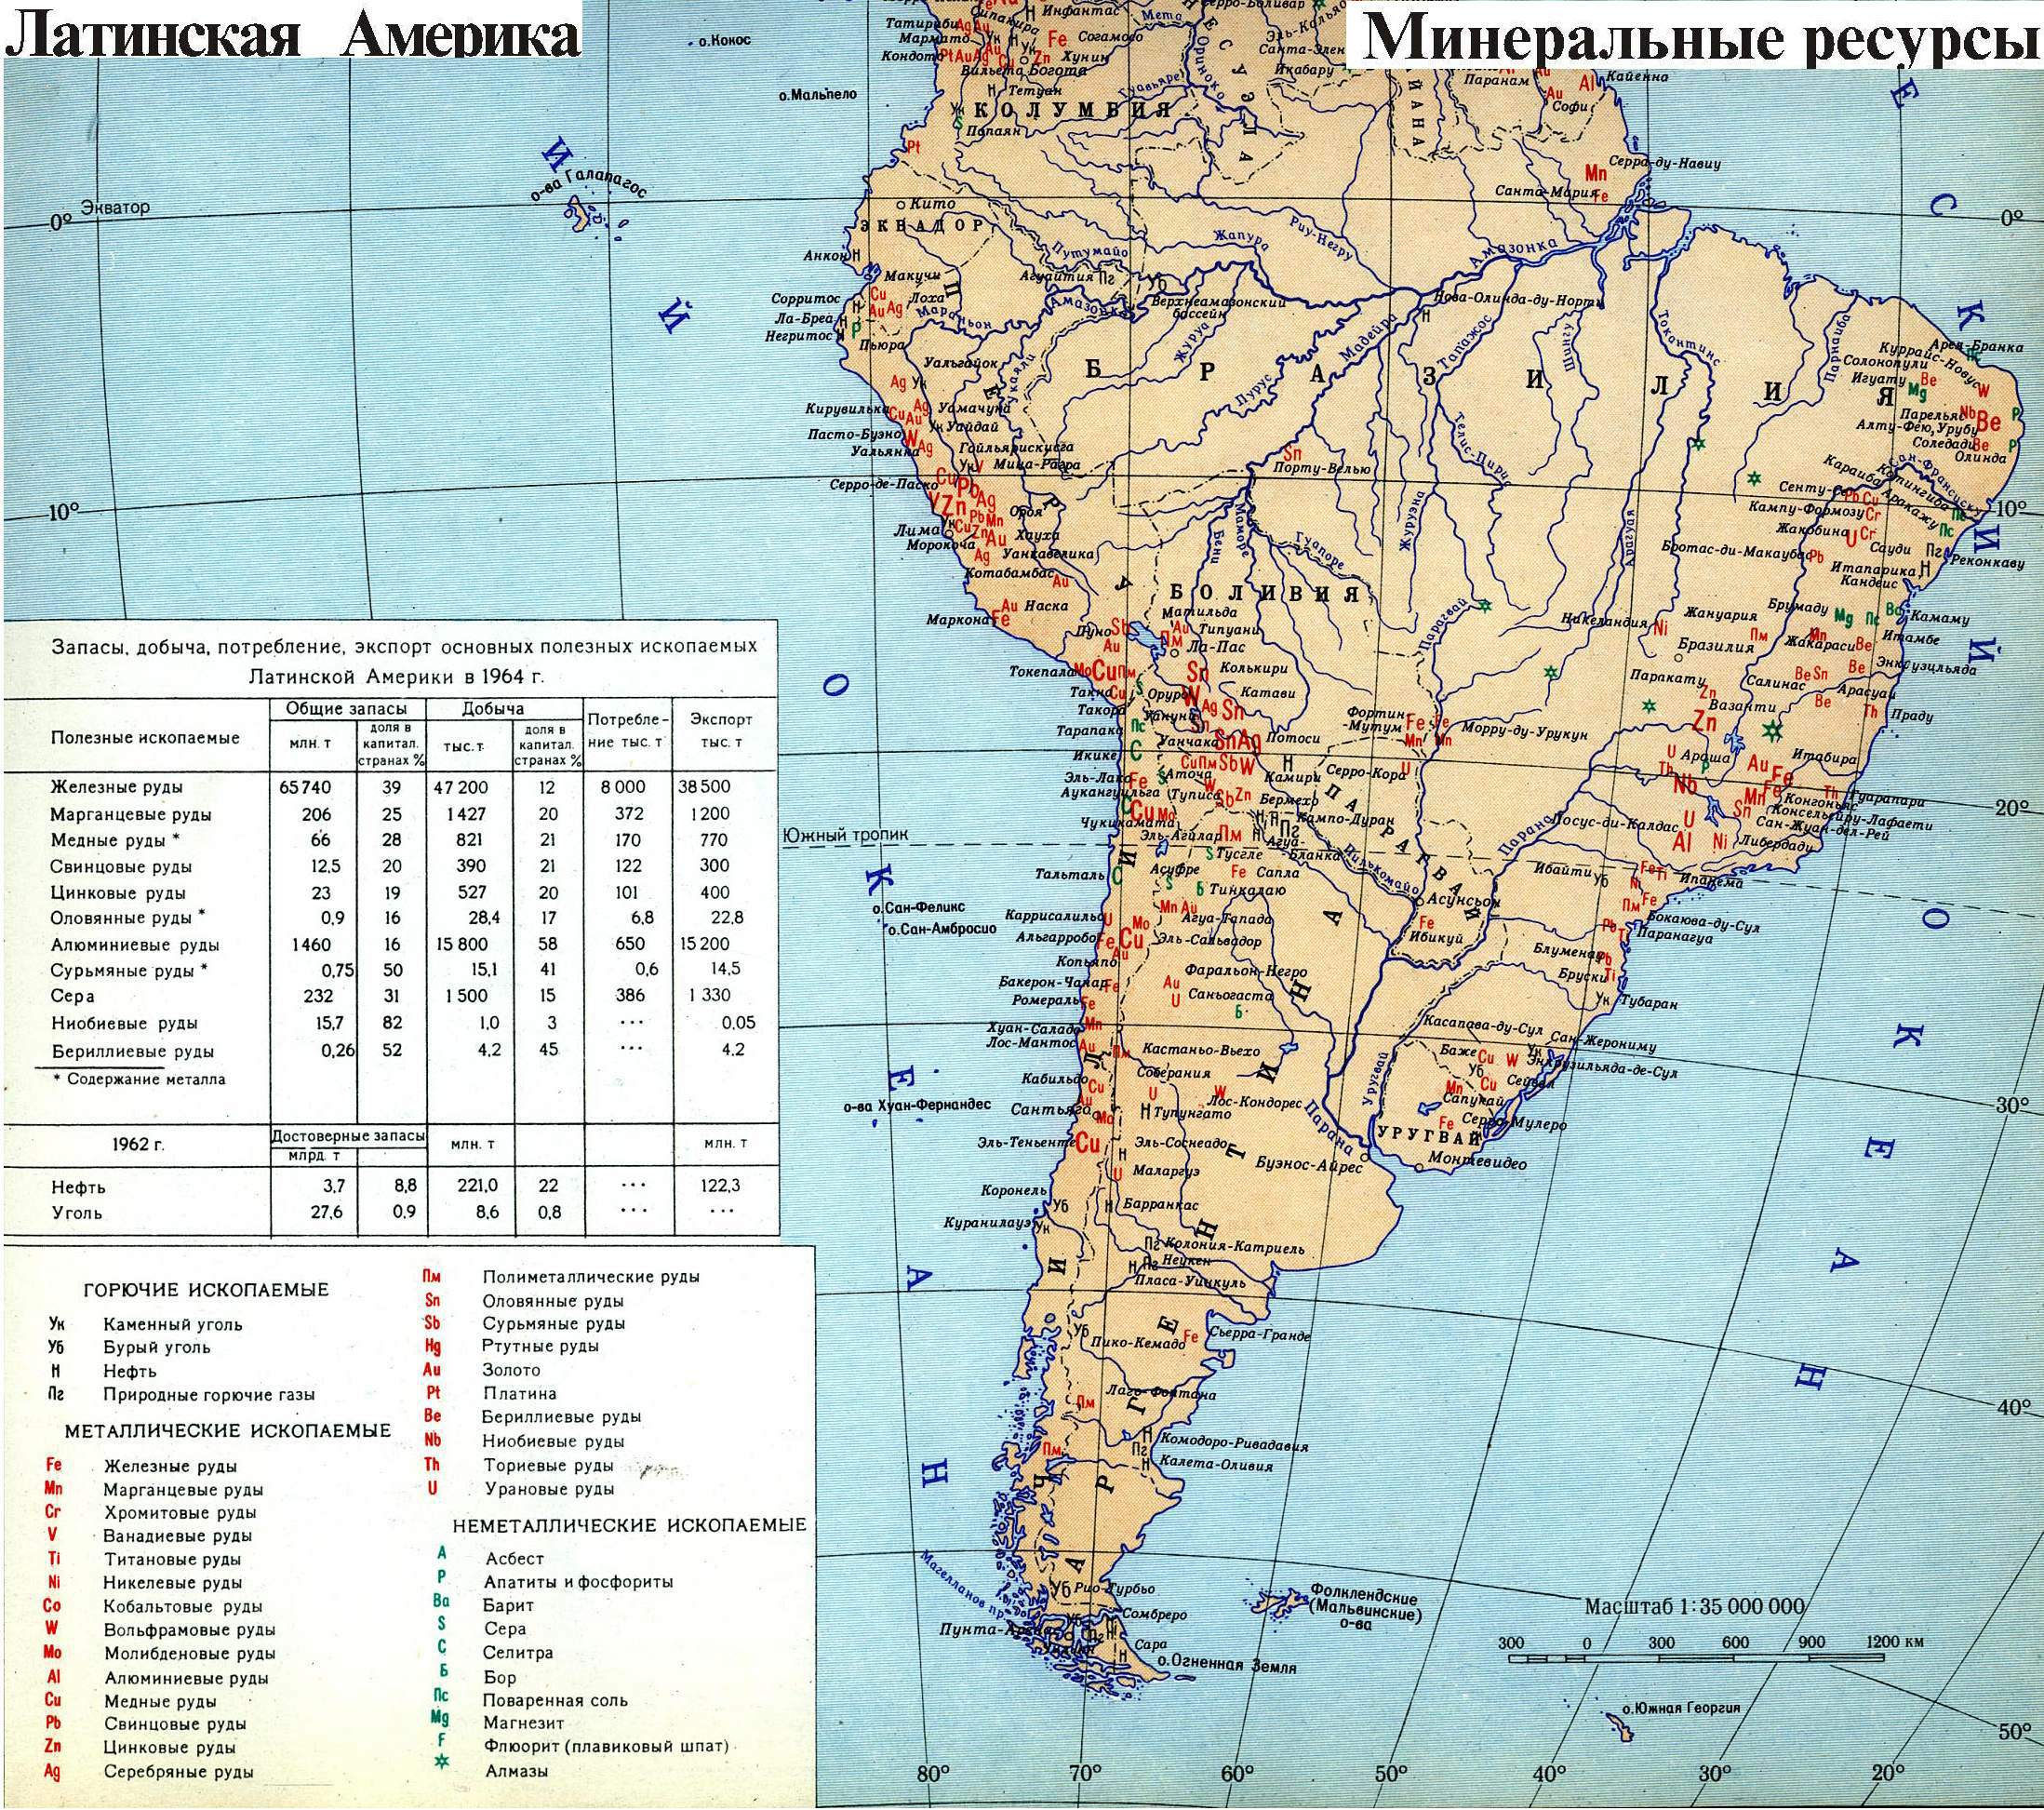
Among abstract symbols the most popular are geometrical figures: circles, squares, rectangles, triangles and others. Geometrical symbols are simple to understand and to perform, they need little place and point to the location of the object very precisely, they can be easily compared by their size. Abstract symbols are often used for marking mineral resources.
It is possible to increase the number of marking objects by changing their color and their inner design.
Letter symbols - that is one or two letters, the names of the marked event, for example, Fĺ and Ni - for marking deposit of iron and nickel. Letter symbols are used in case when one category of products should be distinguished among others. For example, mineral resources among industrial areas that are marked by geometrical symbols. But the use of letter symbols has some restrictions because they don't show the exact location of the object, make the map flashy and it`s hard to compare them.. But this drawbacks are avoidable if letter symbols are written in geometrical figures. That's how the advantages of two types of symbols can be combined.
Visual symbols resemble objects by their appearance. Visual symbols can be symbolic ones, which shape arose associations with the represented event (for example, a picture of anchor for marking harbor marking or the picture of flask for marking chemical plant) and naturalistic, which shape definitely means the marked object (for instance, a picture of tractor for marking tractor-building plants). These symbols are seldom used in scientific and in tutorial maps for they are less convenient for comparison and localization. But visual signs are of great importance for mass maps-posters, where they should be striking, lucid and can be seen from the distance.
As symbols are off-scale representatives they don't express space that is occupied by the correspondent objects on the map. But they allow to find their location that coincide with the center of a sign for the regular geometrical figures. In such case even those symbols that overlap each other leave no questions about their true location.
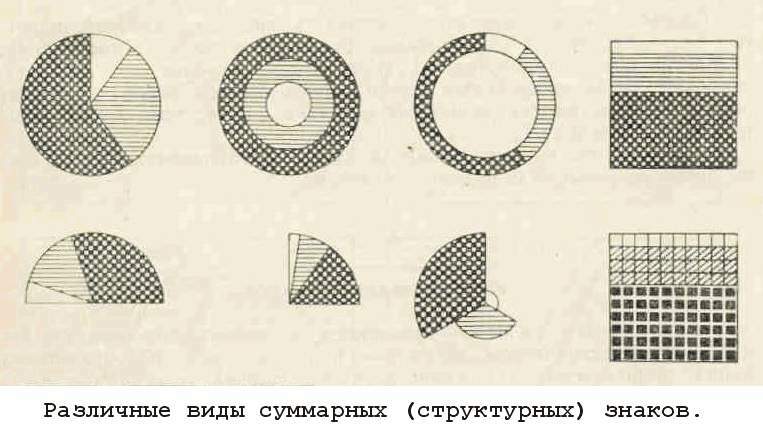
The situation becomes more complicated if several events should be marked at the same position. In such case structural (summarized) symbol is used, but it can occur only in the case when marked events are similar and can be compared. Thus, for example, a settlement on a map can be marked with the help of circle, industries of this very settlement are represented by sectors in this very circle. Size of each sector expresses correlation of branches, e.g. by gross output price. There are several types of structural symbols.
In case the represented objects are different and can't be assembled the symbols of single objects are placed near the dot that marks a settlement.
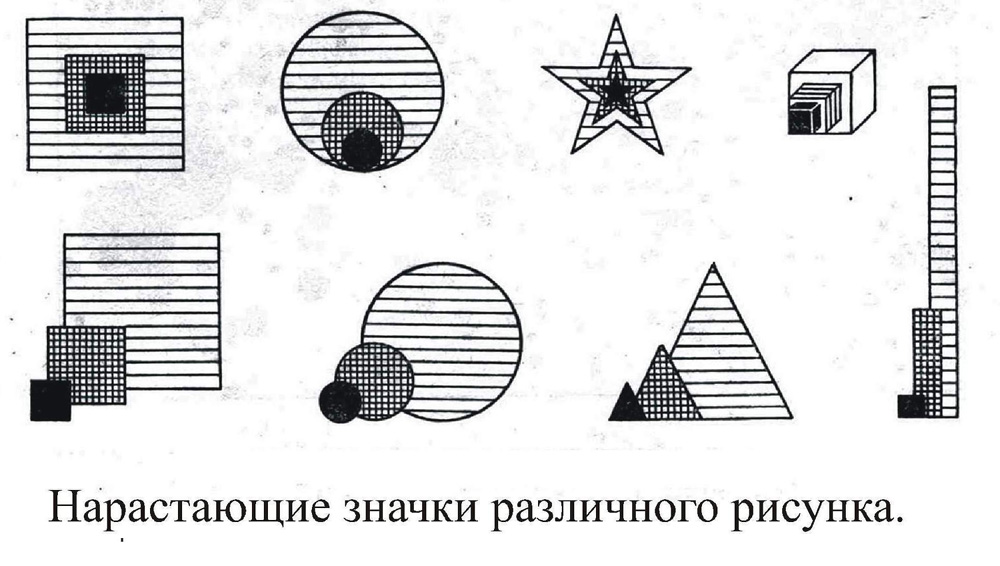
Besides the method of cartographic symbols allows to show dynamics of the explored event within the certain period of time with the help of increasing symbols. For example, the growth of the population within several years for the given dates, pace of development of the event can be shown by the increasing coloring of symbols.
It should be noted that on the maps the signs can be distinguished in the best way by color, then by the size and, at last, by shape.
While using electronic maps a user, depending on the task, can mark out centers of petroleum refilling or only deposits of mineral resources that will be blinking. Besides it`ll be possible to trace the development of deposits, the initial state of developing and current situation (appearing symbols).